


 4
4
Solana broke above pitchfork resistance as a wave of short liquidations reinforced the market’s latest bullish move.
Solana (SOL) has spent much of the current 24-hour session moving quietly in the upper $80s. Buyers have pushed prices out of that holding pattern, driven it through the $90 zone, and carried it as high as about $94 before settling near $93.61, marking a 6.1% daily gain.
What makes this move stand out is not only the breakout itself, but the way Solana has kept hovering close to the top of its range instead of fading back sharply. This points to firm demand and a market that looks more interested in continuation than quick profit-taking.
After weeks of uneven sentiment, this chart suggests Solana may be shifting from a quiet recovery into a louder show of strength. However, the question now is how far Solana can run once momentum turns into full conviction.
How Far Can Solana Run?
Solana’s daily chart is beginning to show a stronger technical posture after weeks of trading inside a downward pitchfork structure. Price has climbed to about $93.43, pressing above the upper half of that channel and finally breaking beyond the pitchfork’s top boundary.
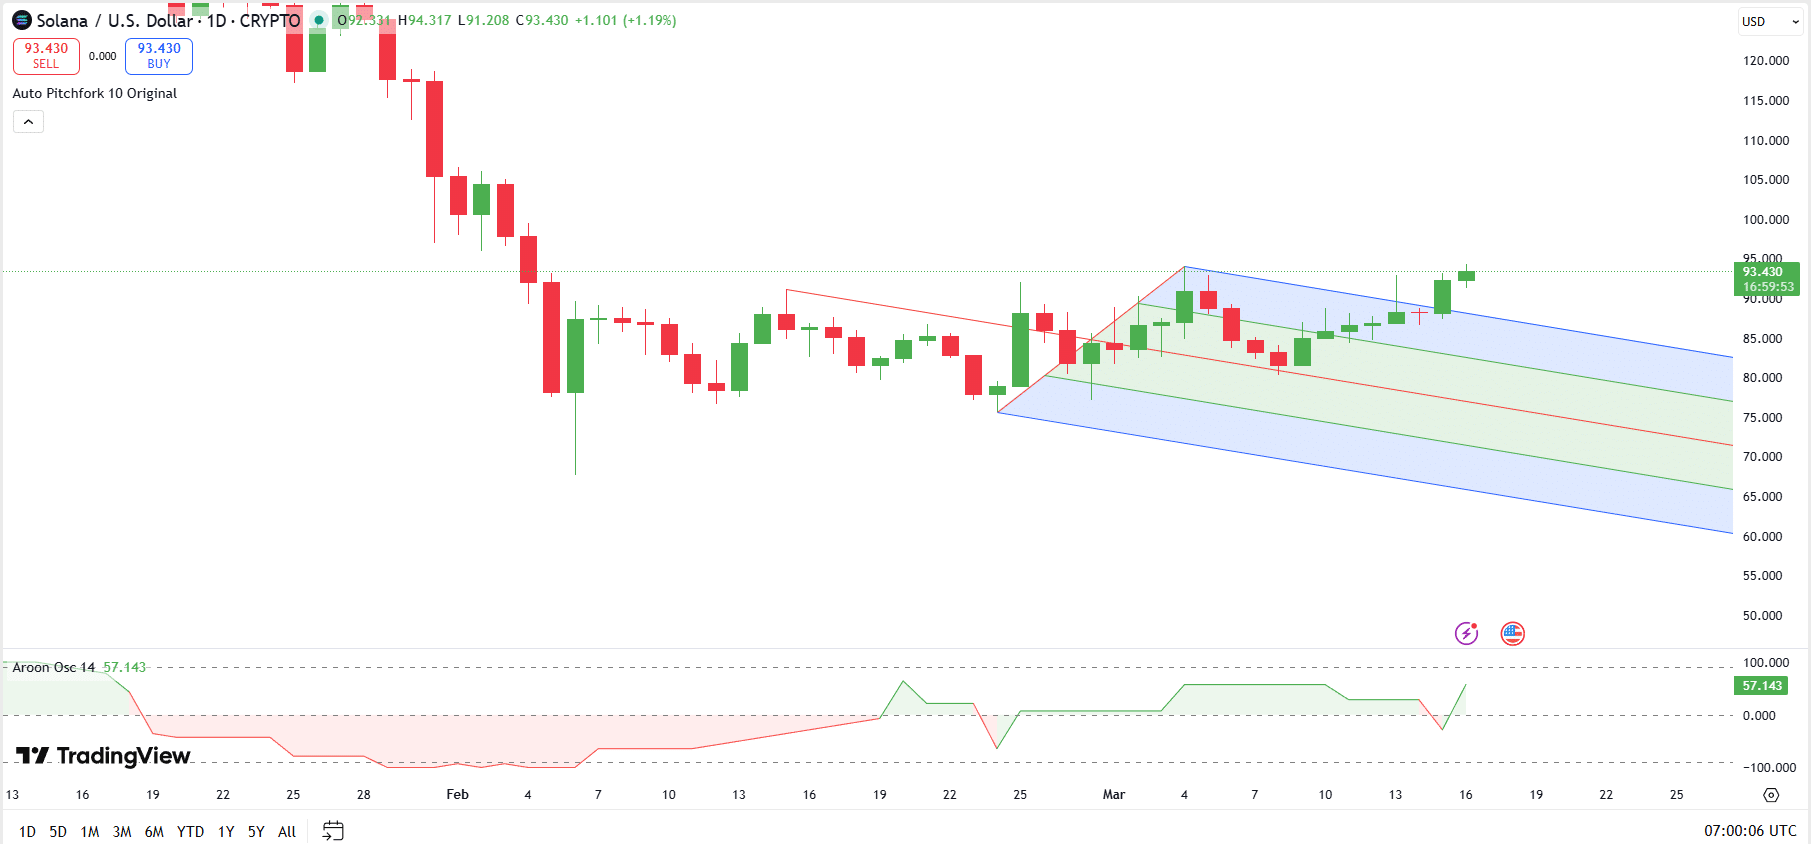
That matters because the pitchfork had framed Solana’s corrective trend, with rallies repeatedly capped by descending resistance. The latest candles suggest buyers are no longer settling for rebounds inside the channel and are instead moving out of it. If that break holds, it will weaken the short-term bearish structure and shift focus toward continuation rather than containment.
The Aroon Oscillator, which sits at 57.143, supports that improving view. The indicator has turned firmly positive again. This shows that upward momentum is strengthening and that recent highs are beginning to dominate over the earlier lows.
Even so, the next test is crucial. Bulls need to keep the price above the former pitchfork resistance zone. A slip back inside the channel would suggest the move was only another temporary rally within a broader corrective trend.
Solana Liquidation Data
Solana’s liquidation data points to a market that was leaning the wrong way as the price moved higher. Over the last hour, total liquidations reached about $27.58K, with almost all of that coming from short positions at $27.57K.
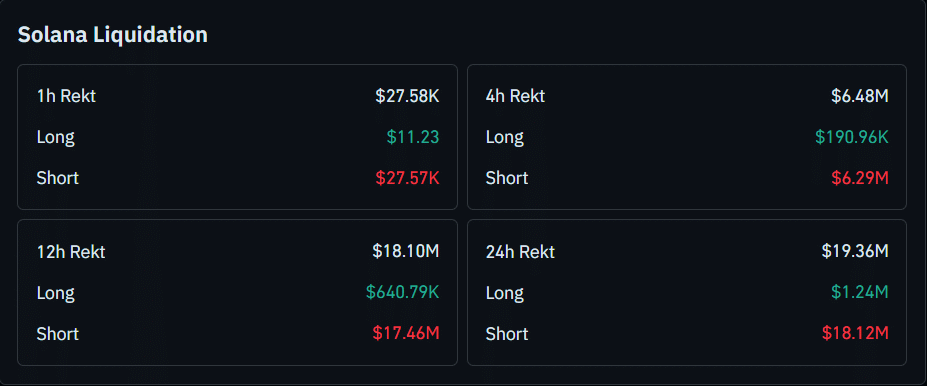
That imbalance becomes much more pronounced on the broader time frames. In the last four hours, $6.29M in shorts were wiped out compared with just $190.96K in longs.
Over the 12-hour window, total liquidations reached $18.10M, with shorts accounting for $17.46M compared with just $640.79K in long liquidations. That imbalance becomes even clearer on the 24-hour view, where total liquidations rose to $19.36M, including $18.12M in short liquidations versus $1.24M on the long side.