
 3
3
While $XRP currently eyes a recovery push, market data suggests it could first drop below the $1 psychological mark before the next bull run.
$XRP has lost 22% of its value in 2025, trading around $1.43 amid a broader crypto market decline that has erased more than 60% of its value from the $3.6 all-time high. While sentiment has turned negative, the current correction may represent a normal part of market cycles.
Data surrounding the Gaussian Channel indicator and major moving averages on the two-week timeframe shows $XRP could witness a short-term relief before a deeper drop, with the cycle low possibly coming in between $0.7 and $0.8, after which a major expansion phase could follow.
Key Points
- While $XRP has dropped 22% this year amid a broader market downturn, market data shows further declines could still play out.
- The price currently sits near $1.37, with the lower end of the two-week Gaussian Channel resting at $0.9, pointing to further potential downside ahead.
- $XRP has only triggered six Gaussian Channel trend flips across its history, and every single one eventually led to the price reaching the lower end of the channel before any real expansion began.
- A short-term relief rally toward the 20 EMA at $2.00 and the 50 EMA at $1.80 could play out in the coming weeks, but this move could be a temporary rebound.
- If $XRP fails to break and hold above $2.4, the deeper correction toward $0.7 to $0.8 remains the most likely outcome through the summer months.
Historical Data Around the Gaussian Channel
This analysis came from market watcher Chart Nerd, as $XRP eyes a recovery push, up 6.91% this week. Chart Nerd based his analysis on the Gaussian Channel indicator on the two-week timeframe.
For context, the indicator uses a green zone to indicate strong uptrends and a red zone to mark bear markets or consolidation phases that come before expansion. The analyst noted that across $XRP’s full price history, the two-week Gaussian Channel has only flipped trends six times, which makes each flip important.
Specifically, after $XRP peaked at $0.06 in December 2013, the price corrected back into the green Gaussian band, touched the lower end of that band, consolidated for roughly a year, and then surged to the 2017 peak of $3.31. After the 2017 high, $XRP re-entered the green channel and eventually found its low at the bottom of that band following the bearish trend flip.
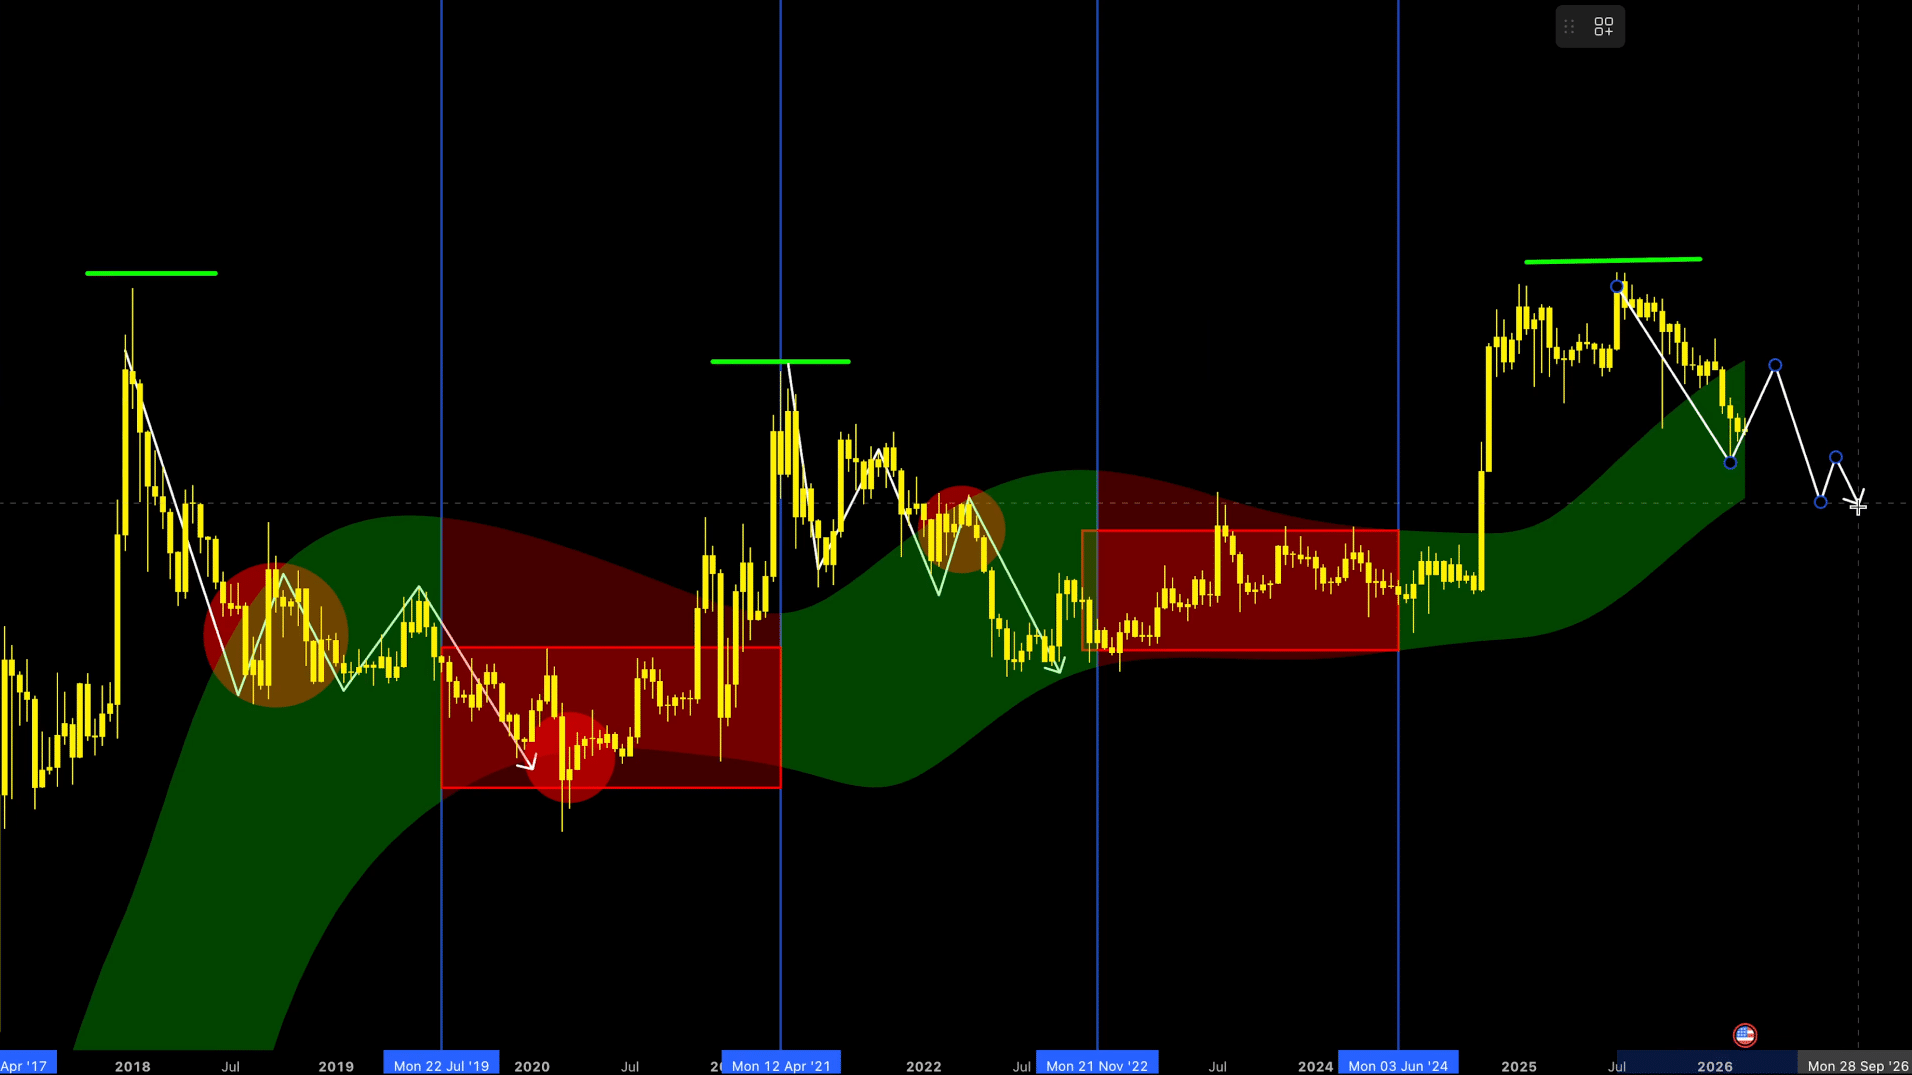
The same thing happened after the 2021 peak of $1.96, where $XRP briefly rallied to the upper band before dropping to the lower end, consolidating, and eventually pushing to the 2025 all-time high of $3.6.
Essentially, every time $XRP leaves a cycle peak and falls back into the Gaussian Channel green zone, it always reaches the lower end of that channel before any real expansion begins.
$XRP Could Rally to $2, But It May Be a Bull Trap
With $XRP sitting around $1.37 at the time of the analysis and the lower end of the two-week Gaussian Channel resting at around $0.9, Chart Nerd said he expects short-term relief before the deeper correction plays out. He highlighted the 20 EMA at $2 and the 50 EMA at $1.8 on the two-week chart as the likely targets for an upcoming relief rally.
The analyst compared the current position to the 2021 cycle, where $XRP first bounced toward the upper end of the Gaussian band and even retested the 50 EMA before eventually rejecting and sliding into a full bear market. He believes $XRP will follow the same path now, rallying into those moving averages before turning back down.
Chart Nerd also called attention to an earlier correction where $XRP dropped 74%, then staged a 170% relief rally before eventually returning to its prior lows, setting a lower high, and then crashing further into the full bear market.
He applied the same pattern to the current situation, warning that even if $XRP recovers all the way back to the $2.4 local high it set in early January 2026, the move could still be nothing more than a dead cat bounce before a deeper drop toward $0.8 or $0.7 later in the year.
The $1.8 Level Is Now the Line Between Recovery and Collapse
Chart Nerd also highlighted the $1.80 price level, which $XRP held as support for more than 400 consecutive days from November 2024 to December 2025 before breaking below it in January 2026. He explained that, as the level held in 2025, he maintained a bullish outlook and expected $XRP to reach new all-time highs in 2026.
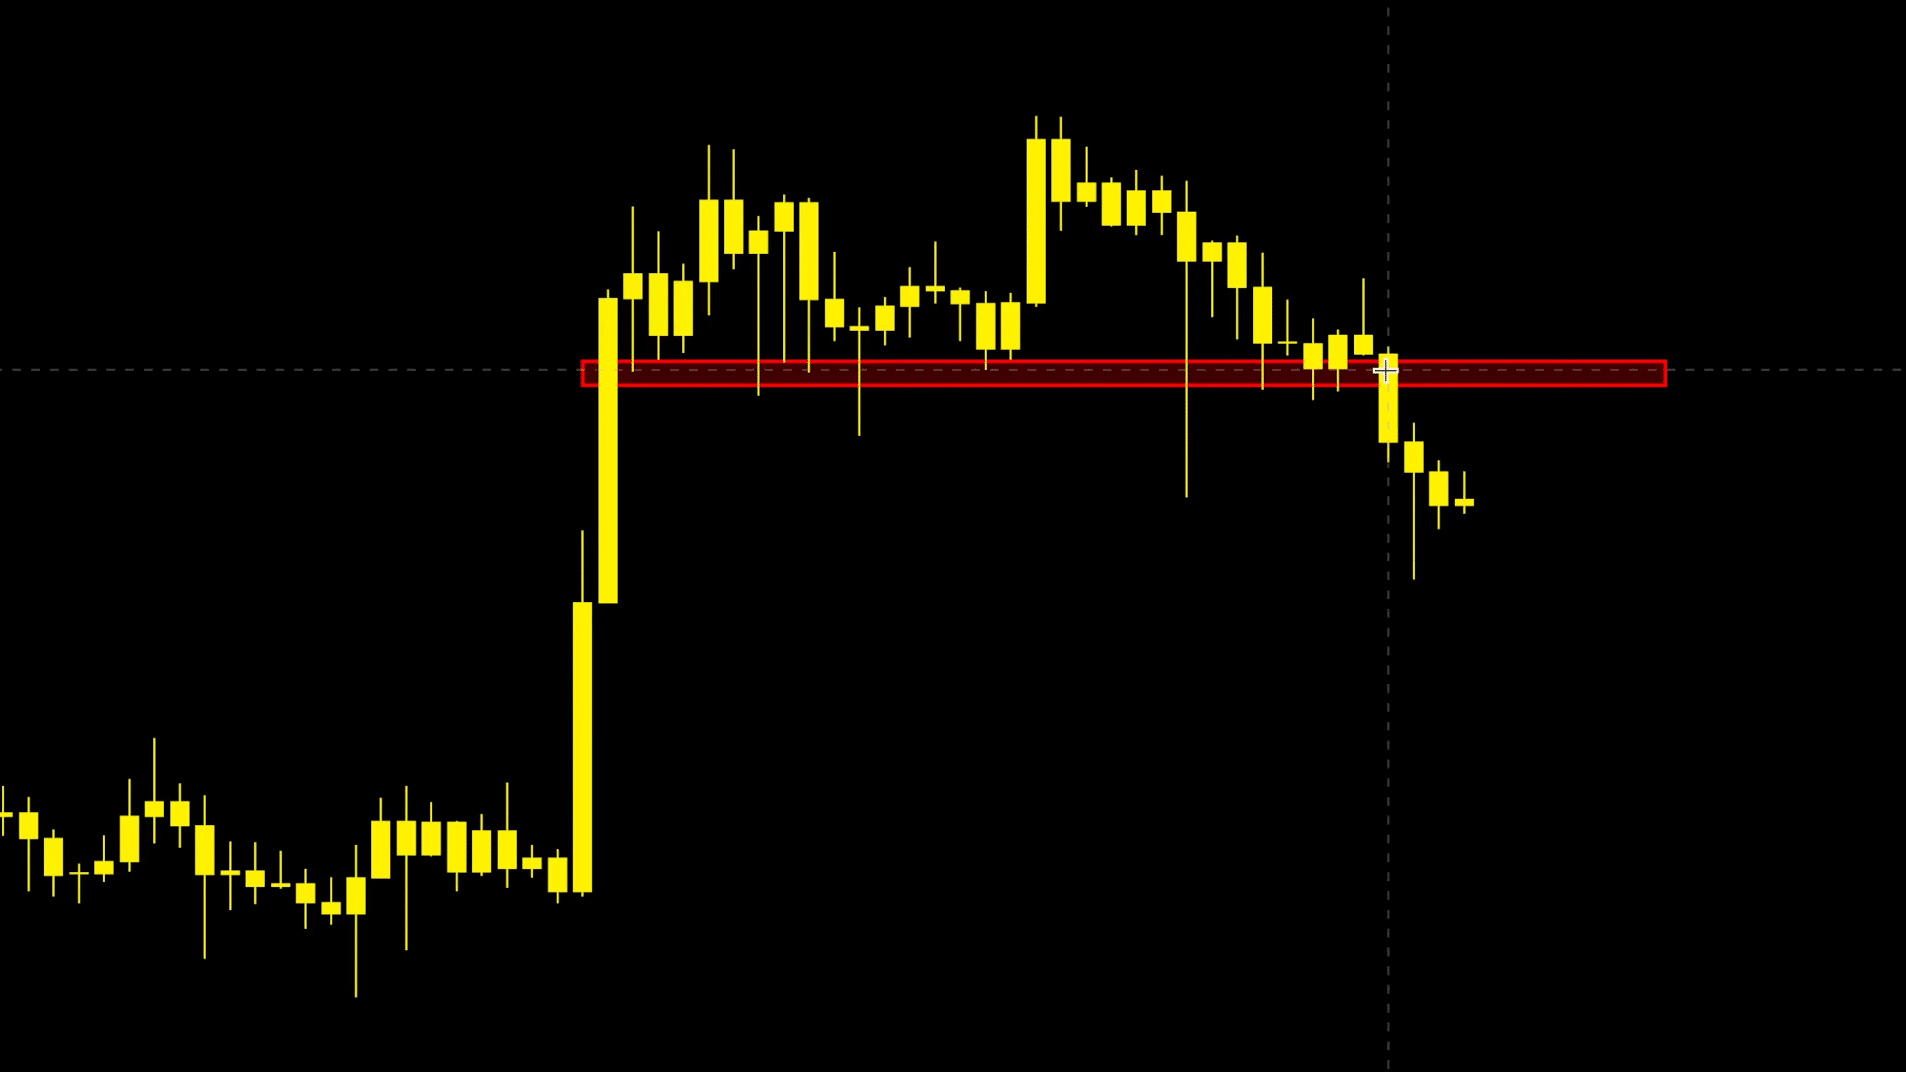
Once $XRP broke below $1.8 at the start of 2026, the market analyst confirmed that he adjusted his view to match what the chart was showing. Now, Chart Nerd treats $1.8 as a key resistance level that $XRP must reclaim and hold before any real recovery can play out.
Specifically, if $XRP pushes back above $1.8 to $2 and holds those levels, the downside targets near $0.70 are off the table. But if $XRP rallies into that zone and fails to clear $2.4, he will take that as confirmation of the dead cat bounce and expect the correction to continue toward the lower targets.

