


 3
3
A market analyst has identified a strong cyclical correlation between Dogecoin and $XRP, suggesting the meme coin could follow a similar multi-year structure that once defined $XRP’s market behavior. The projection points to a potential move toward $1 if the pattern continues to unfold over the coming years.
The outlook, shared by TradingShot on TradingView, highlights structural similarities between Dogecoin and $XRP across previous bull and bear market cycles. The analysis focuses on how both assets reacted after failing to post new all-time highs during their respective rallies.
Multi-Year Structure Shows Symmetry
Dogecoin did not reach a new peak during the 2023–2024 rally. $XRP faced a similar outcome during its 2019–2021 cycle. In both cases, price action rejected prior highs and entered extended corrective phases.
The analyst notes that both cryptocurrencies formed large symmetrical triangle patterns on the monthly timeframe following those rejections. These formations typically reflect prolonged consolidation within narrowing price ranges. Such patterns often precede major breakouts, although direction depends on broader market conditions.
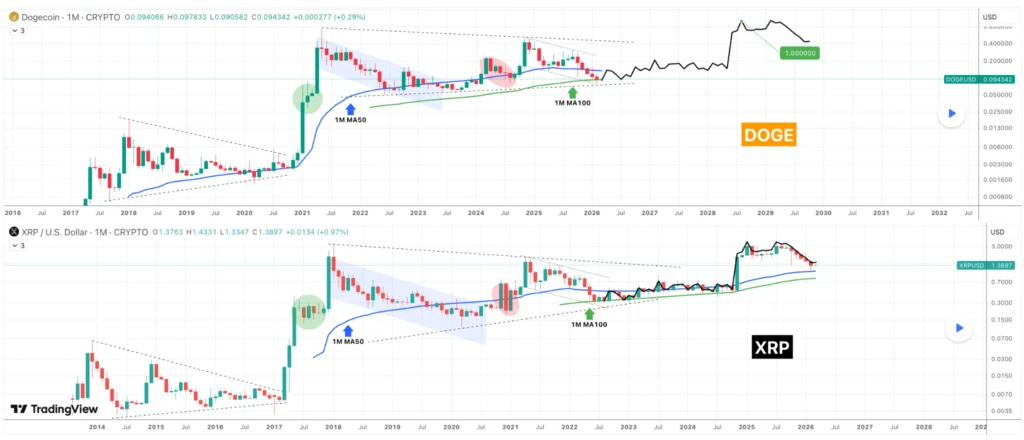
On the monthly chart, Dogecoin is now trading near its 100-month moving average. It also sits close to the lower boundary of its long-term triangle formation. During the recent decline, the 50-month moving average acted as dynamic resistance, limiting recovery attempts.
This setup closely resembles $XRP’s structure in mid-2022. At that time, $XRP found support at its 100-month moving average and the base of its triangle pattern. The asset then consolidated for the remainder of the bear market cycle before stabilizing.
According to the analysis, Dogecoin appears to be trailing $XRP’s macro price action by roughly three and a half years. If the structural symmetry continues, Dogecoin may enter a prolonged period of sideways movement before any major breakout occurs.
The projection places a potential move toward the $1 level in mid to late 2028. The target aligns with the timeline suggested by the historical lag between the two assets’ cycles. The analyst emphasizes that the forecast depends on the pattern remaining intact over the coming years.
Current Price Action Reflects Consolidation
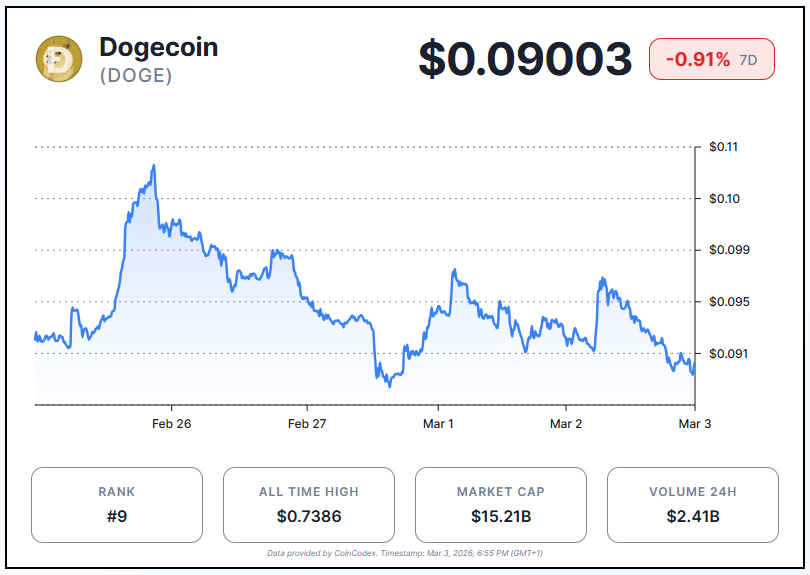
At the time of writing, Dogecoin is trading at around $0.09003. The asset has moved within a tight range over the past week. The memecoin is down 0.91% over the last seven days.
The cryptocurrency remains below its 50-day simple moving average of $0.1109. It also trades under its 200-day simple moving average of $0.1600. This positioning reflects sustained downside pressure. The shorter-term average remains below the longer-term average, reinforcing a broader bearish structure.
Technical indicators show muted momentum. The 14-day Relative Strength Index stands at 42.72. This reading places the asset in neutral territory but closer to the lower end of the range. It suggests that selling pressure has been present but not extreme.
The RSI does not signal oversold conditions. That implies the market has not yet reached exhaustion levels that often precede sharp reversals. Instead, the data points to a period of stabilization within a larger corrective structure.
