


 12
12
$XRP is hovering around the $1.43–$1.46 region after a volatile February, with traders closely watching for signs of a broader trend reversal. One analyst now believes the token is on the verge of entering what he calls a “Phase 4” rally.
- A trader predicts $XRP is nearing a “Phase 4” rally, citing a potential golden cross and bullish candlestick shift.
- $XRP must break above its 50-day SMA to confirm short-term bullish momentum.
- Failure to hold current levels could invalidate the bullish retest and expose $1.20 support.
In a recent post, the trader said: “A trend reversal signal for $XRP is imminent.”
A trend reversal signal for $XRP is imminent.
— CW (@CW8900) February 25, 2026
The candlestick will soon turn green, and a golden cross on the suib-indicator is going to appear soon.
The real rally of Phase 4 is about to begin. pic.twitter.com/35qFPVdynx
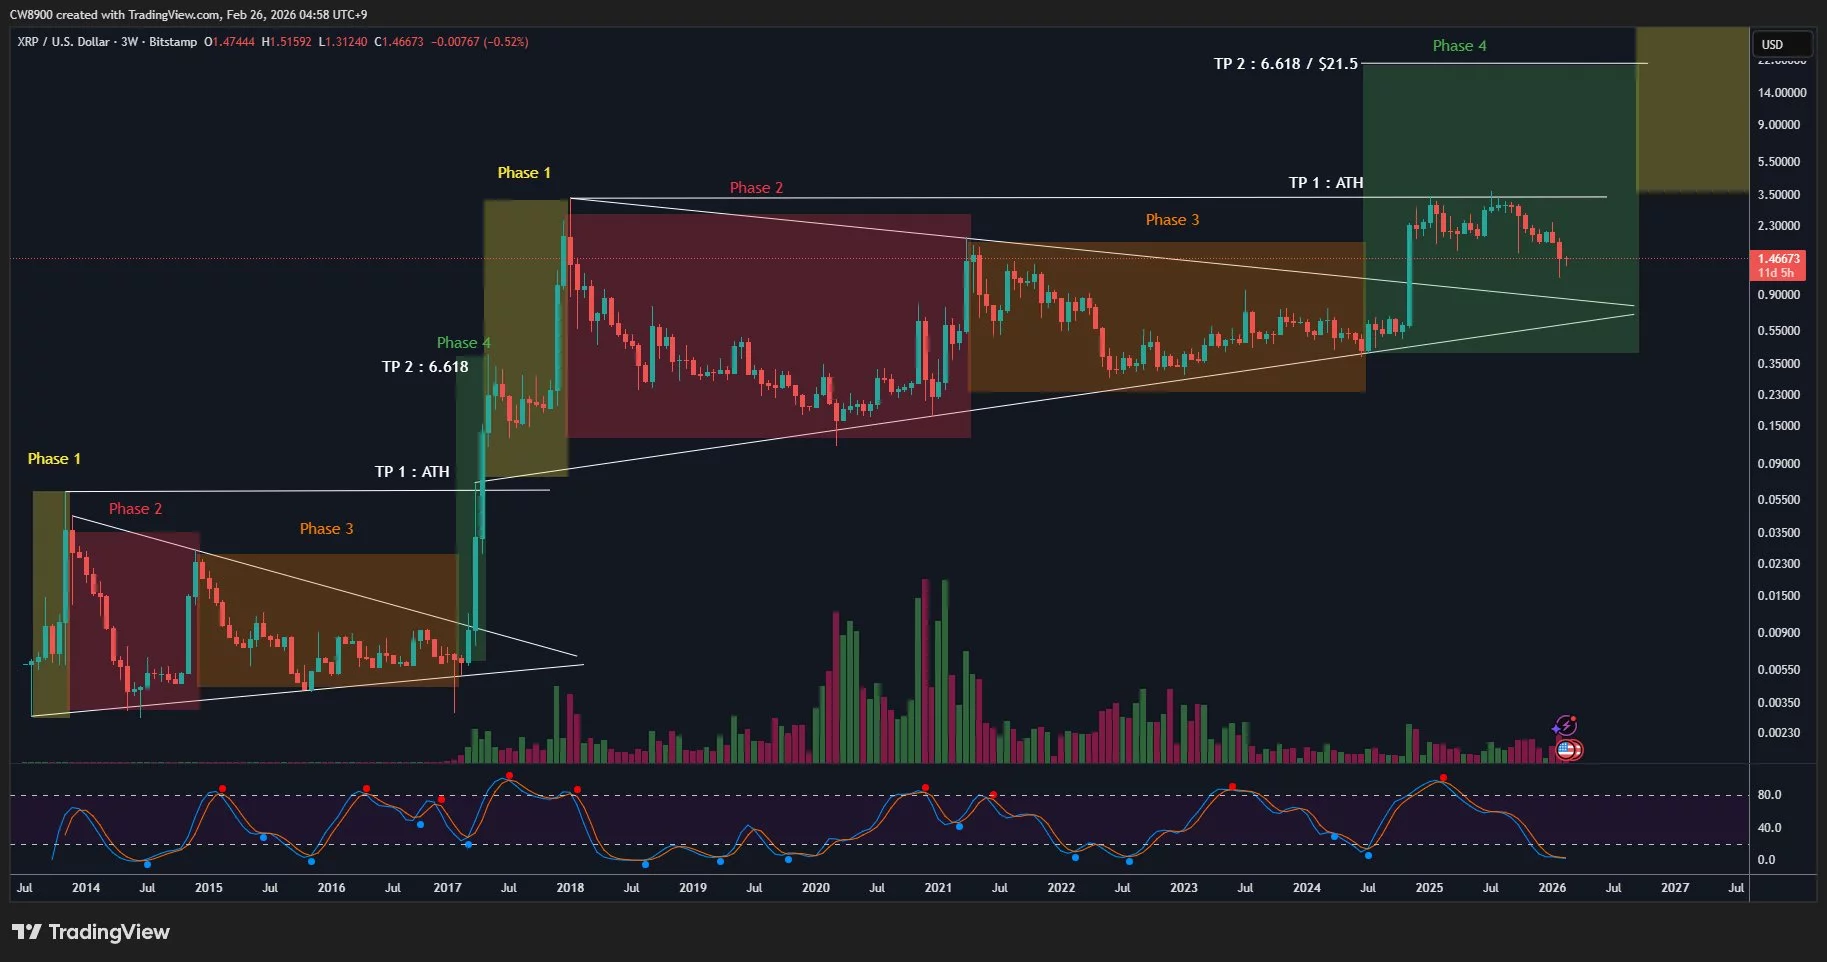
The trader’s long-term chart outlines a multi-cycle structure divided into four phases. Historically, Phase 1 marked accumulation and breakout, Phase 2 a corrective consolidation, and Phase 3 a prolonged compression within converging trendlines.
The current structure shows $XRP price recently breaking above a multi-year symmetrical triangle before pulling back toward the upper trendline, a classic retest scenario.
The highlighted “Phase 4” zone projects an expansion phase targeting previous all-time highs first (TP1: ATH), followed by an extended Fibonacci projection near $21.5 (TP2: 6.618), though such levels remain highly speculative.
$XRP price tests key resistance as momentum slowly rebuilds
On the daily timeframe, $XRP’s price action shows stabilization after a sharp drop earlier this year. The 14-day RSI sits near 44, recovering from oversold territory but still below the neutral 50 mark, suggesting momentum is improving but not yet decisively bullish.
Meanwhile, $XRP remains below its 50-day simple moving average (SMA), currently near $1.69, which acts as immediate resistance. A sustained move above this level could strengthen the bullish case and confirm short-term reversal momentum.
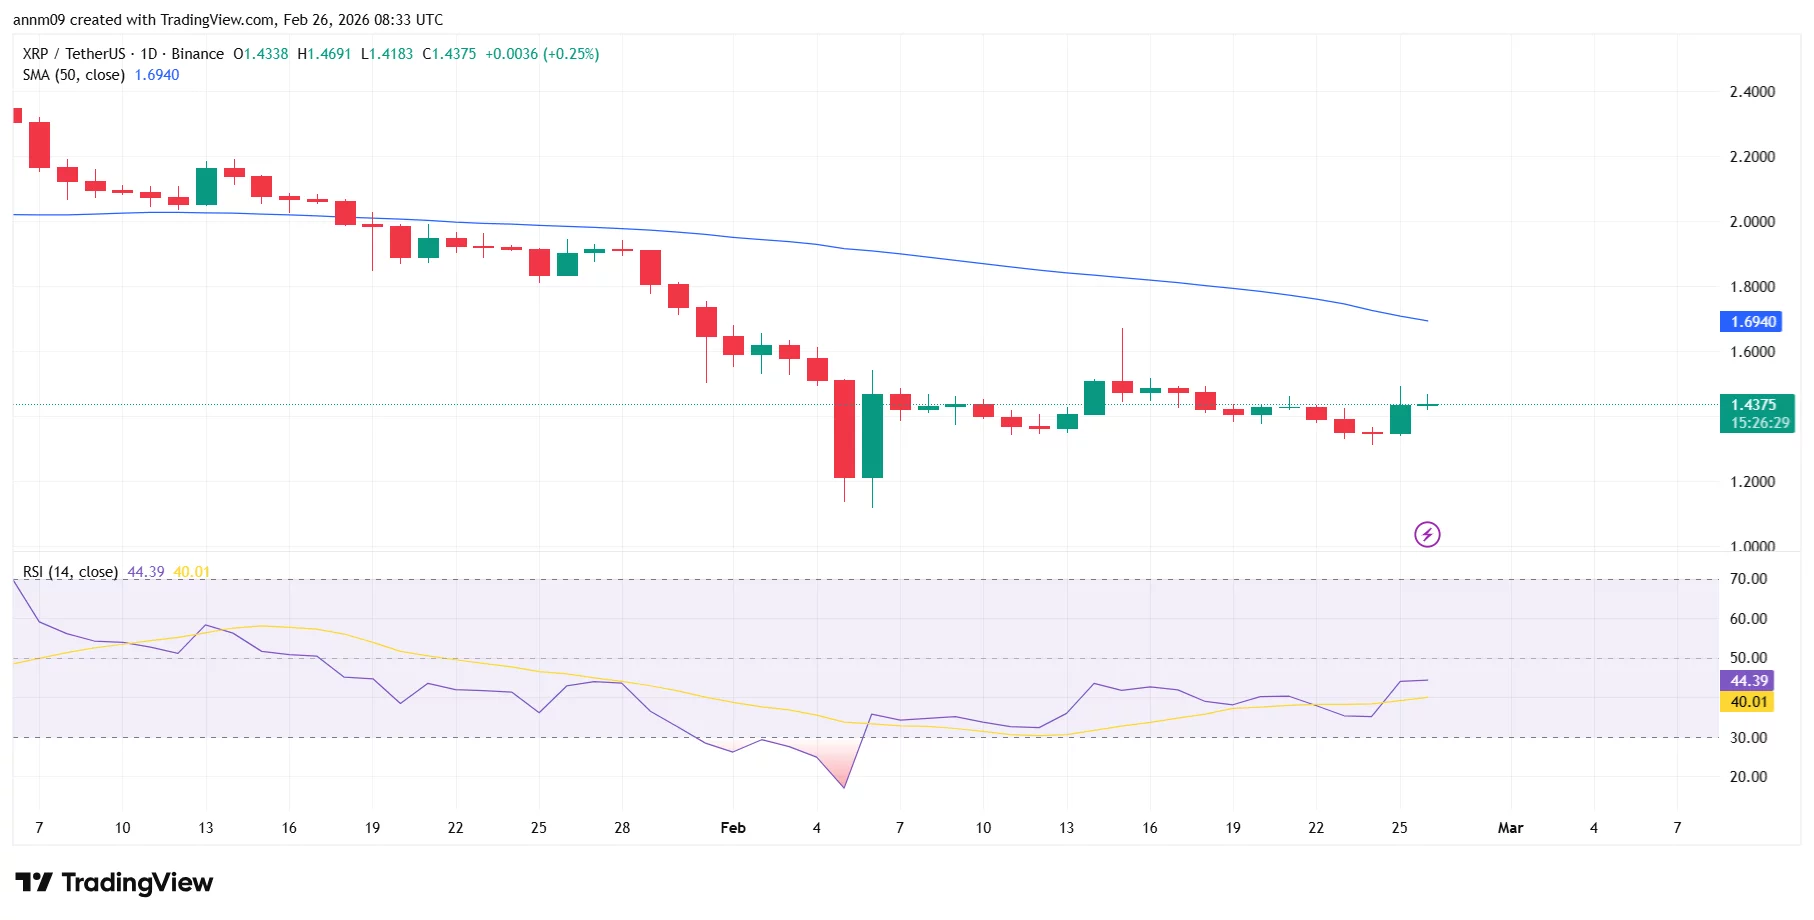
On the downside, key support lies near $1.30–$1.35, with stronger structural support around $1.20. A breakdown below those levels would invalidate the bullish retest narrative.
For now, $XRP sits at a technical crossroads with traders watching closely to see whether this is merely consolidation or the beginning of Phase 4.