


 3
3
Solana flipped a downside range break back into support after a quick sweep on both sides of the range. Meanwhile, traders pointed to bullish divergence signals that could grow across higher timeframes if support holds.
Solana reclaims breakdown after range sweeps, analyst flags bullish divergence
Solana traded near $78 on Coinbase’s 4 hour SOLUSD chart after price swept both sides of a recent range and then reclaimed a break to the downside, according to crypto trader Bluntz Capital, who posts on X as @Bluntz_Capital. The latest candle in the screenshot showed $SOL at about $78.27, up roughly 1.25% on the session, after earlier trading between about $77.23 and $78.56.
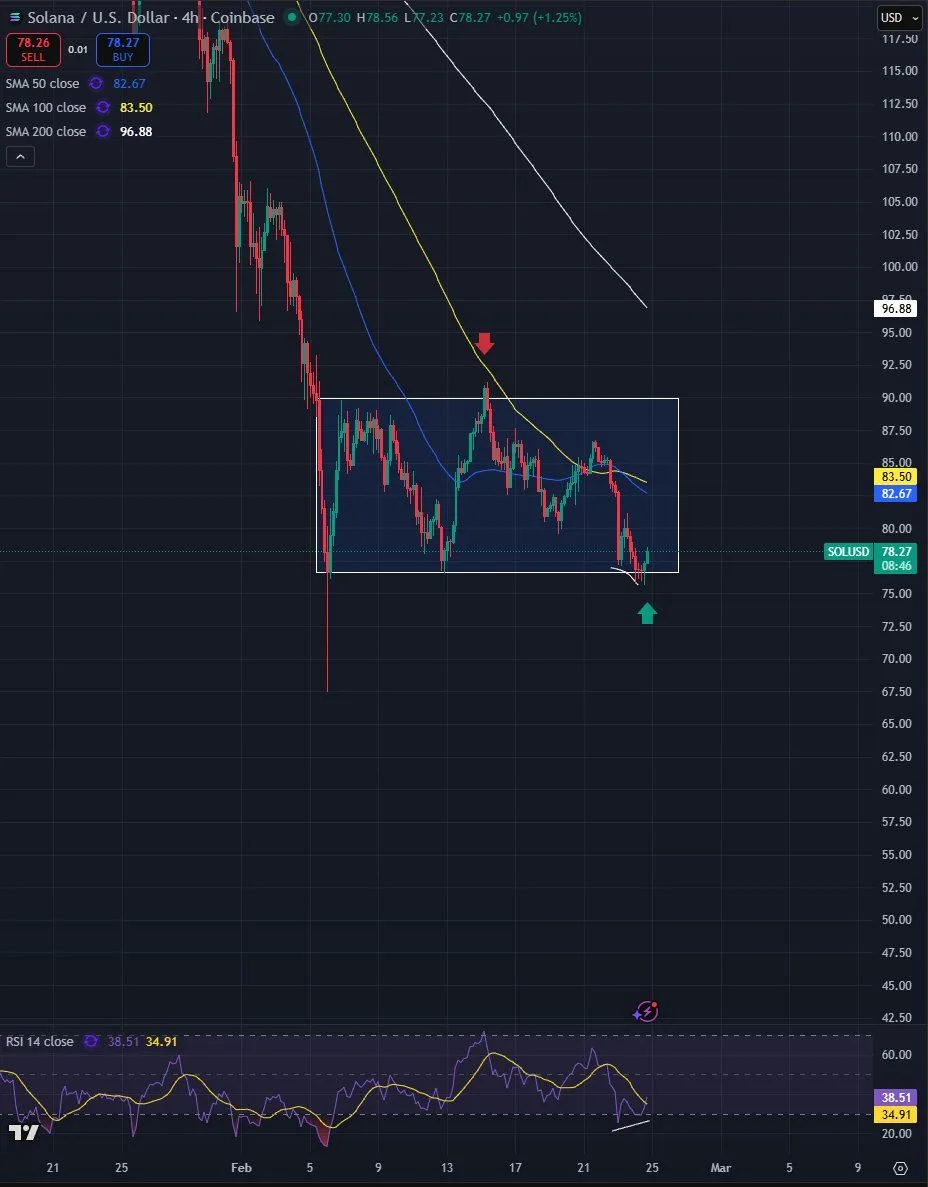
Solana U.S. Dollar 4 hour chart (SOLUSD, Coinbase). Source: TradingView / X
The chart showed Solana still below key moving averages, with the 50 period simple moving average near $82.67 and the 100 period near $83.50, while the 200 period sat much higher around $96.88. Inside the marked range box, price pushed below the lower boundary before snapping back, a move the analyst described as a reclaimed breakdown following a liquidity sweep.
Bluntz said the setup includes a bullish divergence on the 4 hour timeframe and argued it could extend into a daily bullish divergence and later a 3 day signal. He added that sentiment on “crypto TL” has turned gloomy during the pullback, while he described the sharper capitulation move as occurring a little more than two weeks earlier.
Solana holds $75 support as analyst maps rebound toward $100
A 12 hour $SOL/USDT chart on Binance showed Solana trading inside a defined accumulation range, with repeated defenses near the $75 area and capped moves below a resistance band just under $90, according to analyst CryptoCurb, who posts on X as @CryptoCurb. The chart marked several downside probes that held near the lower boundary, followed by rebounds back into the range, a structure the analyst framed as sustained support.
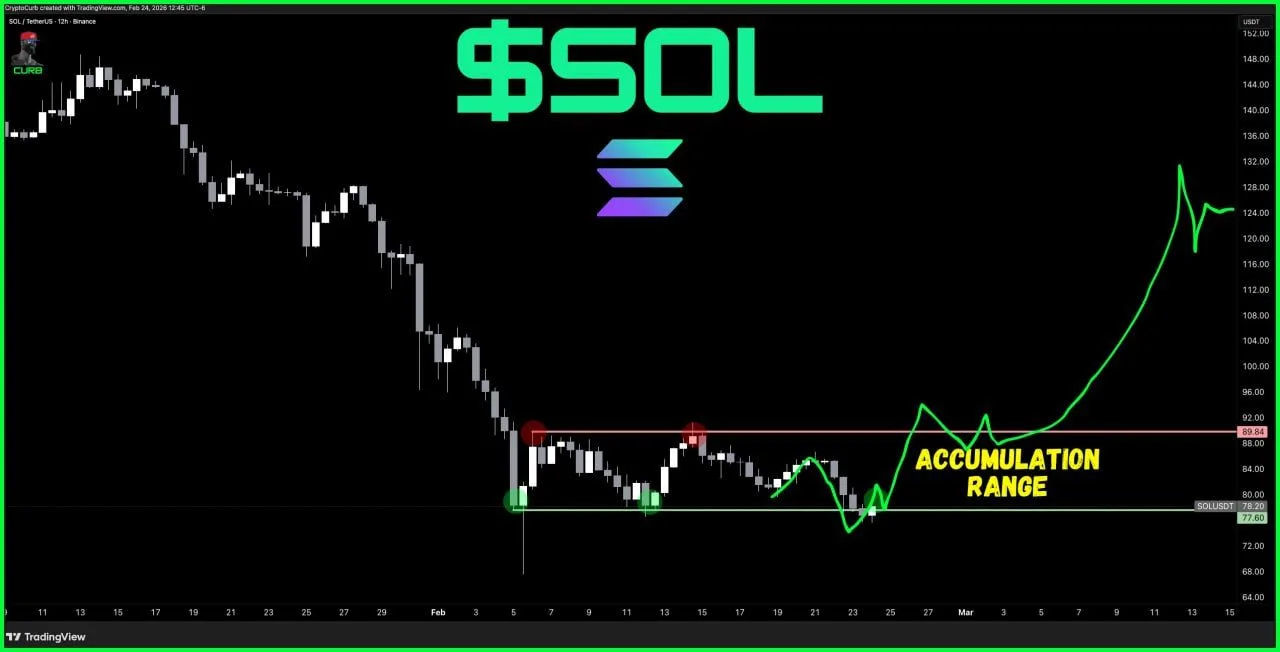
Solana Tether 12 hour chart (SOLUSDT, Binance). Source: TradingView / X
The visual also showed two failed pushes near the upper boundary of the range, where price rolled over after testing the same resistance zone. Inside the boxed area, price oscillated between the range low near the mid $70s and the upper band just below $90, signaling compression after a broader downtrend that unfolded earlier in the month. The setup highlighted a pause in directional momentum after the prior selloff.
CryptoCurb wrote that holding the $75 area keeps the path open for a move back toward the $100 region. The chart overlaid a projected path that curves higher after a final dip inside the range, then accelerates once price clears the upper boundary. The projection reflects the analyst’s roadmap rather than confirmed price action and shows how a breakout from the accumulation zone could develop if support continues to hold.
