


 7
7
Hedera’s native token, $HBAR, is attempting to regain lost ground after weeks of constrained trading. The price recently approached the $0.10 threshold but failed to secure a decisive breakout. Since the beginning of the month, resistance near this level has limited upward progress.
While $HBAR briefly reclaimed $0.10, momentum stalled just below a key technical barrier. Traders have adjusted their positioning, though not decisively in favor of sustained upside.
$HBAR Holders Are Buying
The Money Flow Index, or MFI, indicates that buying pressure is gradually building on $HBAR. This volume-weighted momentum indicator measures capital inflows and outflows based on both price and trading volume. Currently, the MFI is positioned above the neutral 50 mark, signaling that buyers are regaining influence.
An MFI reading in positive territory suggests accumulation may be underway. Rising inflows often precede price appreciation, especially when supported by higher trading activity. If this trend continues, $HBAR could benefit from sustained accumulation, strengthening the case for a recovery attempt above immediate resistance levels.
Want more token insights like this? Sign up for Editor Harsh Notariya’s Daily Crypto Newsletter here.
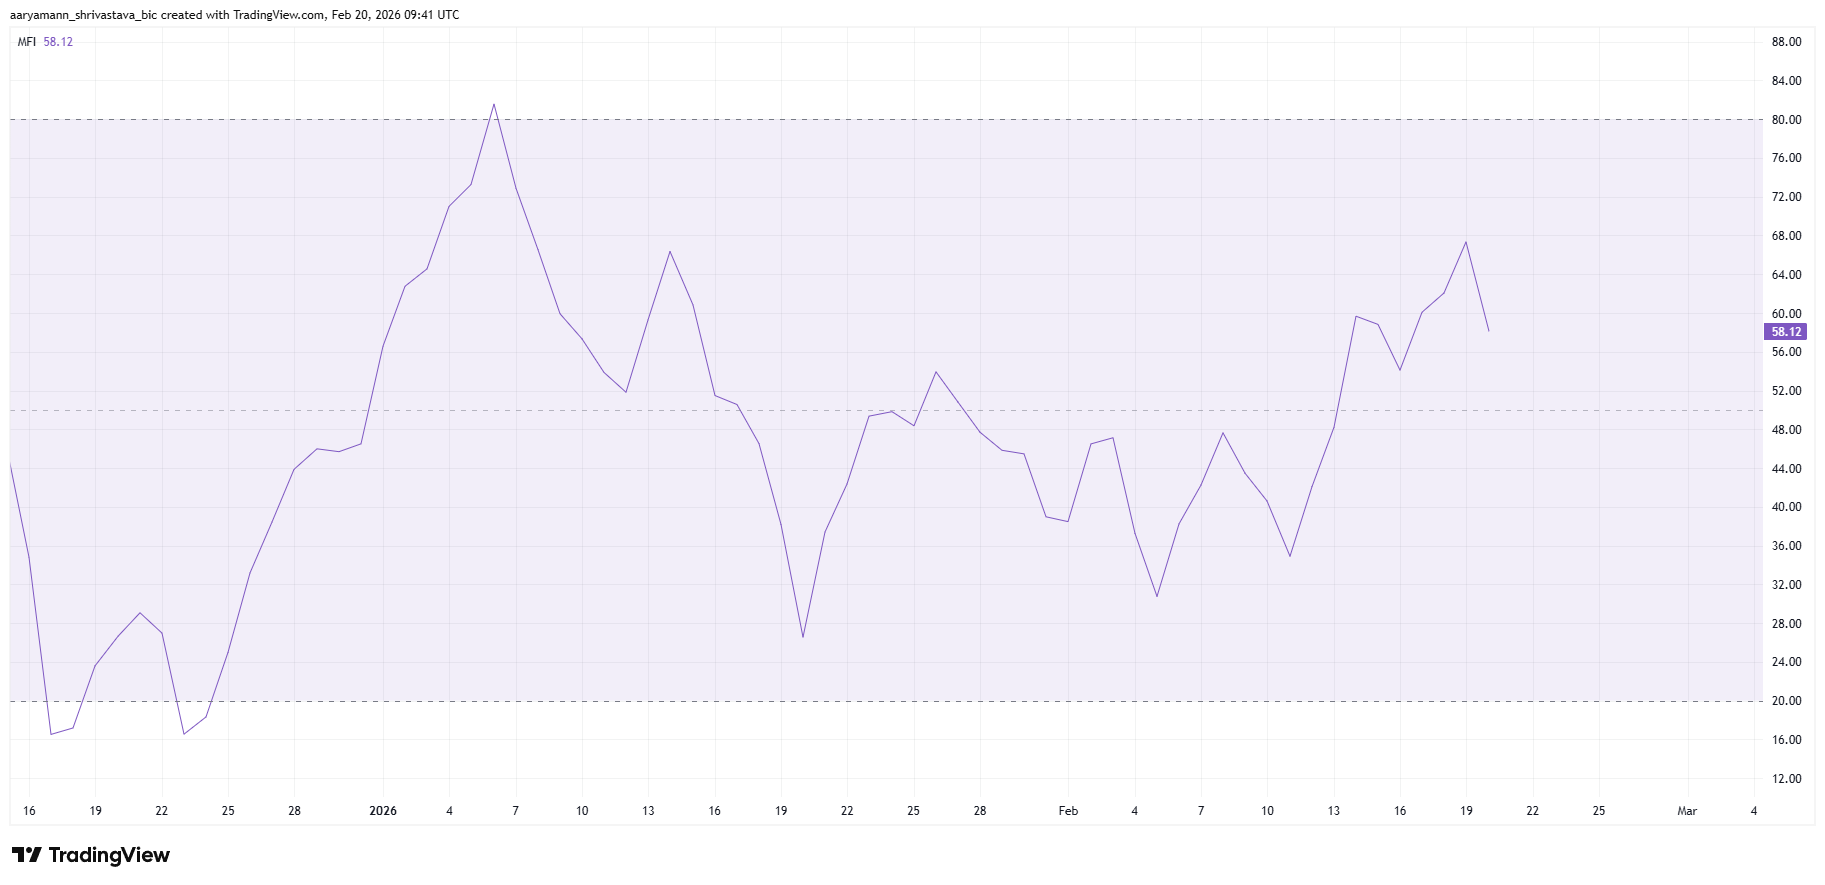 $HBAR MFI">
Hedera Traders Remain Skeptical
Broader derivatives data offer a mixed but slightly constructive outlook. $HBAR’s funding rate is currently skewed toward long positions, indicating that traders are willing to pay a premium to hold bullish contracts. Positive funding rates typically reflect expectations of upward price movement.
However, volatility in the funding rate over the past two weeks highlights lingering uncertainty. Between February 6 and February 11, short contracts dominated open interest, placing downward pressure on $HBAR. This dominance quickly reversed, turned positive, and then shifted negative again.
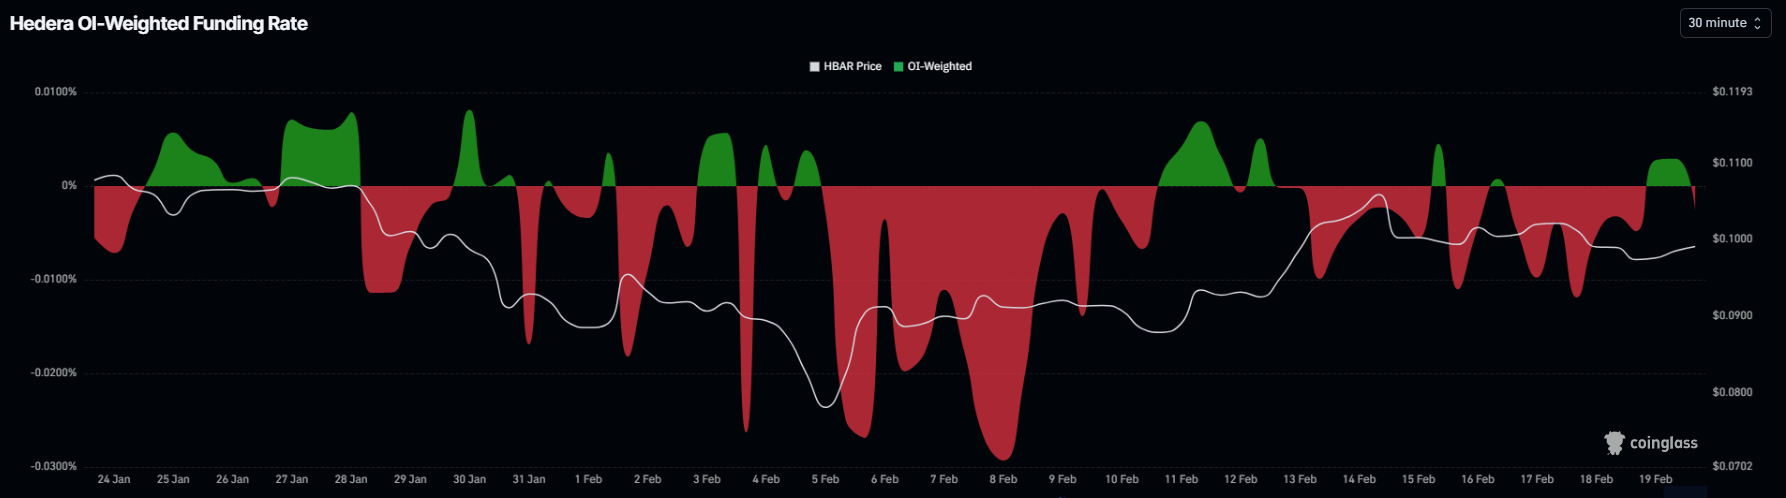 $HBAR Funding Rate">
Such fluctuations reveal hesitation among leveraged traders. Although short dominance has declined recently, conviction remains fragile. Stable positive funding would strengthen the bullish thesis, but current data suggests sentiment is still reactive to short-term price swings rather than anchored in long-term confidence.
$HBAR Price Aims High
$HBAR is trading at $0.0992 at the time of writing. The token remains above the $0.0961 support level, which aligns with the 38.2% Fibonacci retracement. Holding this level is technically significant, as it represents a key inflection point for trend continuation.
However, resistance at $0.1035, at the 50% Fibonacci retracement, is capping upward movement and limiting breakout attempts.
A decisive move above $0.1035 would signal a short-term structural shift. Turning this resistance into support could attract fresh demand, particularly if buying pressure continues to rise.
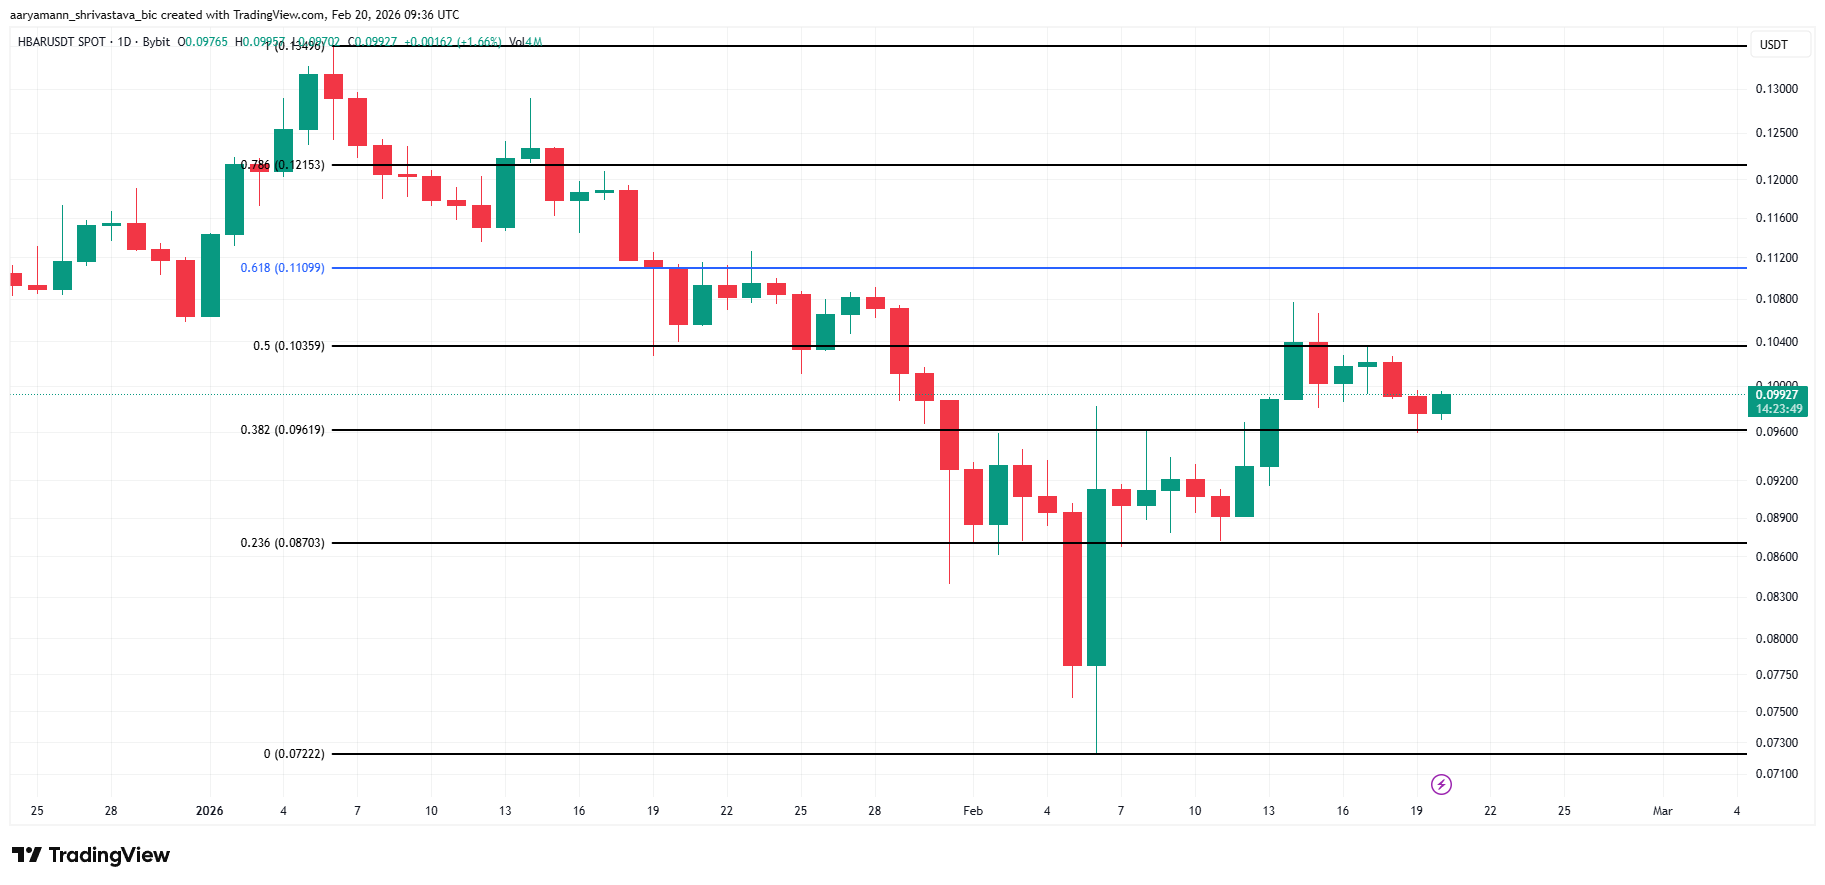 $HBAR Price Analysis. ">
The next target would stand at $0.1109, corresponding to the 61.8% Fibonacci retracement. This level is widely monitored by traders and often acts as a strong support zone once reclaimed.
However, if bullish indicators fail to strengthen, consolidation may persist near current levels. Continued outflows would weaken breakout attempts and reinforce resistance at $0.1035.
A breakdown below the $0.0961 support would shift the short-term structure bearish. In that scenario, $HBAR could decline toward $0.0870, invalidating the immediate recovery outlook and restoring stronger control to sellers.
The post $HBAR Knocks on $0.10 Again as Buyers Return—but Resistance Still Holds appeared first on BeInCrypto.

