


 24
24
Cardano has traded in a tight range as traders watch whether it could close above the middle Bollinger Band and signal a momentum shift.
Cardano ($ADA) is currently trading at $0.2743, down approximately 0.4% over the past 24 hours, reflecting mild short-term weakness. Based on the 1-day chart, $ADA’s intraday price action has fluctuated between roughly $0.2682 and $0.277, marking a relatively tight daily range.
Price initially traded near the upper boundary of this range before sliding toward the mid levels, then attempting a modest rebound. Despite the bounce, $ADA remains below its earlier intraday highs, suggesting buyers have not fully regained control.
$ADA is down 0.36% in 24 hours, but up 3.85% over 7 days. However, the bigger picture remains pressured, with declines of 21.69% over 30 days, 32.94% over 90 days, and nearly 70% over 180 days. With Cardano still pinned inside a tight range, the next decisive move will likely come from a clean breakout or breakdown, making the next session a key test of conviction.
Cardano Price Analysis
On the daily chart, Cardano is trading just below the middle Bollinger Band (around $0.2756), which now acts as immediate dynamic resistance. The upper Bollinger Band near $0.3012 represents the next major resistance zone. For bulls to regain short-term control, $ADA would need a decisive close above the middle band, followed by a push toward the upper band.
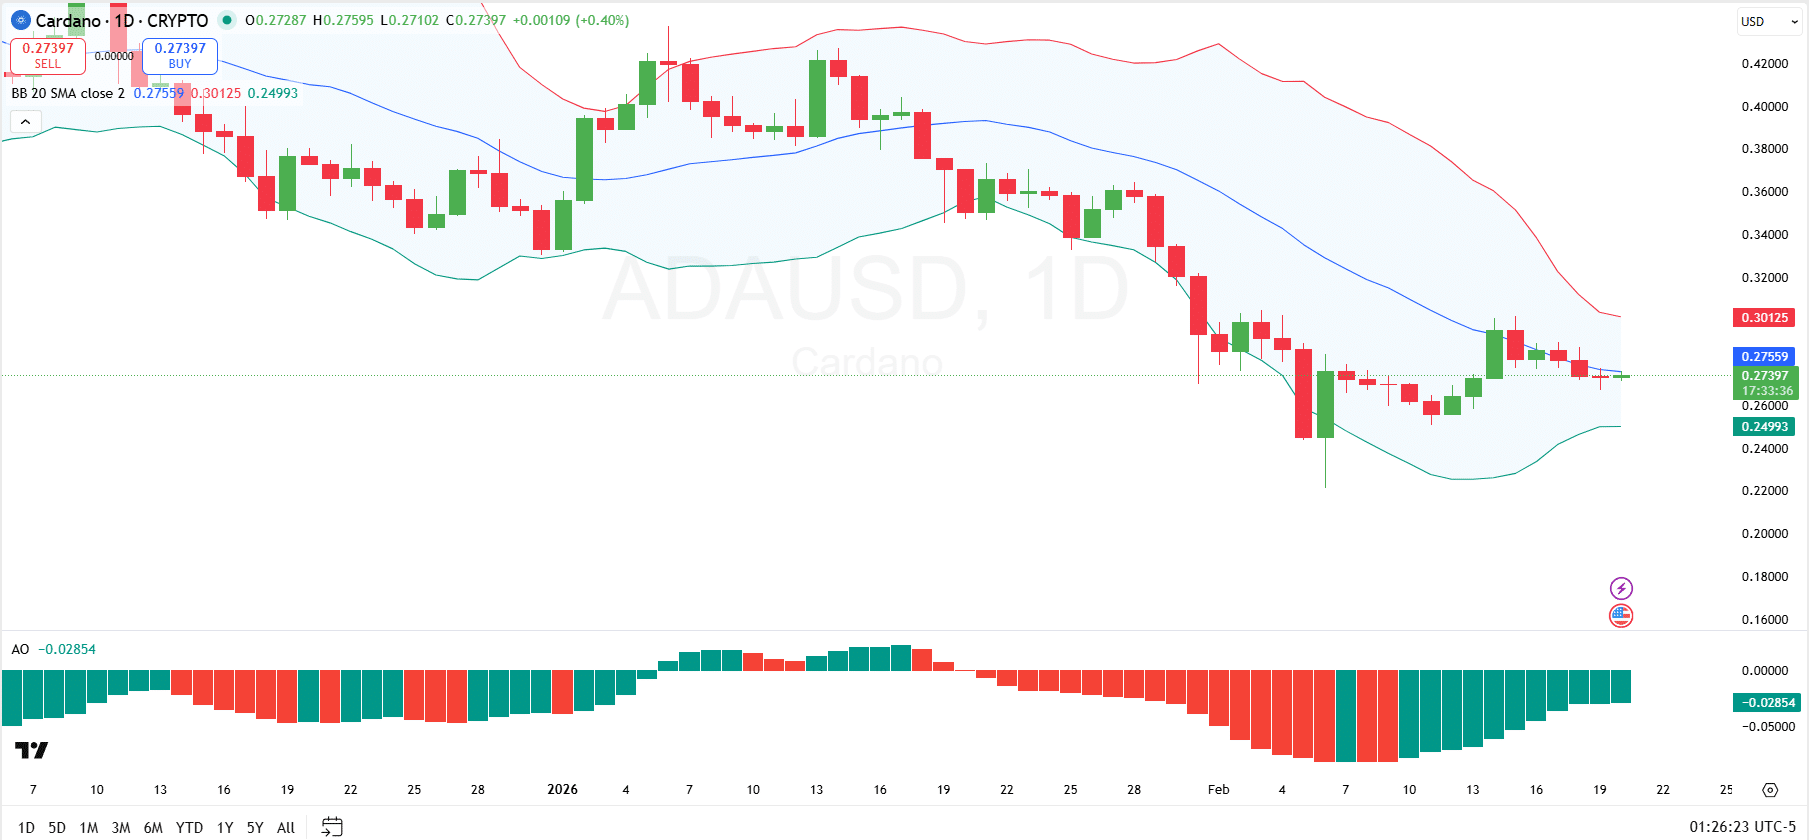
Repeated rejections near the mid-band suggest sellers are still active on relief rallies, keeping upside attempts contained. On the downside, the lower Bollinger Band sits near $0.2499 and serves as key dynamic support. A breakdown below this lower band would signal renewed bearish momentum and could expose deeper downside toward the $0.2200 zone.
Looking at momentum, the Awesome Oscillator remains below the zero line at approximately -0.0285, indicating that bearish momentum is still technically dominant. However, the histogram bars are gradually turning greener and shrinking in size, suggesting that downside pressure is weakening. A move back above the zero line would be an early signal of a potential momentum shift in favor of bulls, while continued rejection below zero would confirm that the broader downtrend structure remains intact.
Cardano Futures Flows
Meanwhile, Cardano’s futures flow data shows a short-term burst of buying interest, but the broader picture still leans cautious. Over the past hour, inflows of $8.32M exceeded outflows of $6.30M, producing a $2.02M net inflow, suggesting a brief pickup in leveraged positioning.
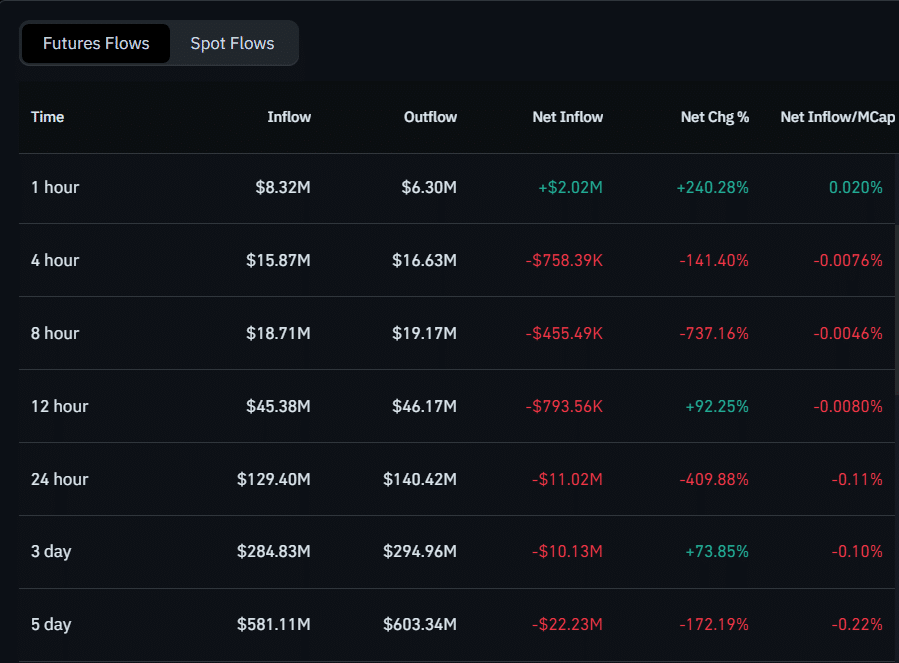
However, that strength doesn’t carry through the larger windows: the 24-hour period shows a $11.02M net outflow (outflows $140.42M vs inflows $129.40M), while the 3-day and 5-day readings remain negative at -$10.13M and -$22.23M respectively, signaling that, despite intermittent rebounds, traders have generally been reducing exposure rather than steadily adding to it.