


 14
14
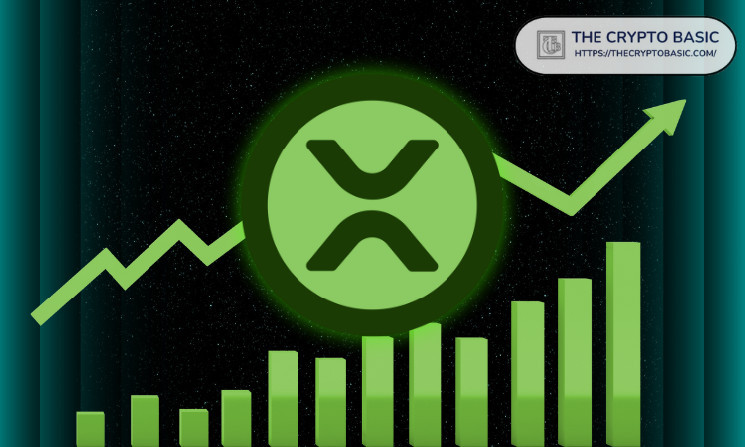
An $XRP Fibonacci extension target now eyes a two-digit price after $XRP’s price successfully backtested its 1-month triangle breakout.
$XRP has faced bearish pressure over the past few months alongside a broader market downturn. As a result, prices have collapsed since $XRP reached the $3.66 peak in July 2025. Currently trading for $1.42, $XRP has dropped by more than 61% from the $3.66 peak, recording six monthly red candles out of seven since then.
Interestingly, $XRP’s latest downtrend aligns with a backtest of an earlier symmetrical triangle breakout that occurred in November 2024. With the latest drop to the $1.11 floor, $XRP retested the support at the upper trendline of this triangle and recovered immediately, successfully backtesting the breakout.
Key Points
- $XRP has been at the mercy of the bears since the $3.66 peak in July 2025, now down 61% from this high amid six monthly red candles.
- This downtrend comes as the broader market suffers intense selling pressure that has wiped out $1.52 trillion from the crypto market since October 2025.
- Amid the downward push, $XRP suffered a sharp decline on Feb. 5, leading to a 15-month low of $1.11.
- Market data confirms that this crash helped $XRP retest the upper trendline of a multi-year symmetrical triangle it broke out of in November 2024.
- $XRP recovered immediately from this $1.11 floor, successfully backtesting the symmetrical triangle breakout, with Fibonacci extension levels pointing to a $19 target.
$XRP Pulls Back After Triangle Breakout
This came from an analysis from “$XRP Captain,” a pseudonymous market commentator and $XRP community member. Notably, data from his chart shows that the ongoing $XRP downturn, which has led to 61% in losses, actually represents a natural pullback after a symmetrical triangle breakout.
For context, the symmetrical triangle started forming after $XRP dropped from the $3.31 high in January 2018. From here, prices saw lower highs and lower lows, forming a symmetrical triangle that lasted for nearly eight years. A breakout occurred in November 2024, when the Trump-inspired upsurge pushed $XRP from $0.5 to above $2.
The breakout rally spilled into 2025, eventually taking $XRP to a new all-time high of $3.6 in July 2025. However, from this peak, a pullback emerged, leading to the ongoing downtrend. This pullback is a natural next step after a triangle breakout to test the strength of the breakout before the next leg up.
Successful Backtest of the Triangle Breakout
The downturn intensified as the market entered this month, with a steep decline coming on Feb. 5. Specifically, $XRP crashed by more than 19% on that day, marking its largest intraday decline since May 2021. Interestingly, this Feb. 5 crash, which took prices to a low of $1.11, helped $XRP to retest the upper trendline of the symmetrical triangle.
Following this retest, $XRP immediately recovered, now changing hands at $1.42. This event marked a successful backtest of the symmetrical triangle breakout, confirming that the breakout featured sufficient strength to push prices to greater heights.
From here, $XRP now eyes higher targets, with the 1.272 Fibonacci level around $5 representing the first extension beyond the July peak of $3.66. Beyond this, $XRP eyes the Fibonacci 2.618 extension at $19.4, marking the ultimate target on the 1-month chart. $XRP would need to surge 1,266% from the current price to reach $19.4.