


 8
8
Shiba Inu faces resistance at a key level, with the price showing neutral momentum and potential for upward movement if it breaks a key barrier.
Shiba Inu ($SHIB) changes hands at $0.000006502, experiencing a 0.8% decline over the past 24 hours. The price has witnessed moderate volatility, with a 24-hour trading range from $0.00000644 to $0.000006579. The coin’s price action shows fluctuations, currently settling in the mid-range.
The 24-hour trading volume stands at $124.61 million, down over 20%, highlighting declining activity during this period. Over the past 7 days, Shiba Inu has gained 9.9%, which contrasts with its more substantial 30-day loss of 17.1%.
Looking at Shiba Inu’s current performance, the price has had a hard time moving past the $0.00000658 mark in the past 24 hours, with a pullback observed. If it manages to break this upper range, a further move upwards could be expected. Can $SHIB break the resistance?
Shiba Inu Price Analysis
On the technical side, Shiba Inu is currently facing resistance near the $0.00000733 level, as indicated by the Supertrend indicator, which is showing a bearish signal. This resistance zone is significant since $SHIB has struggled to break through it recently.
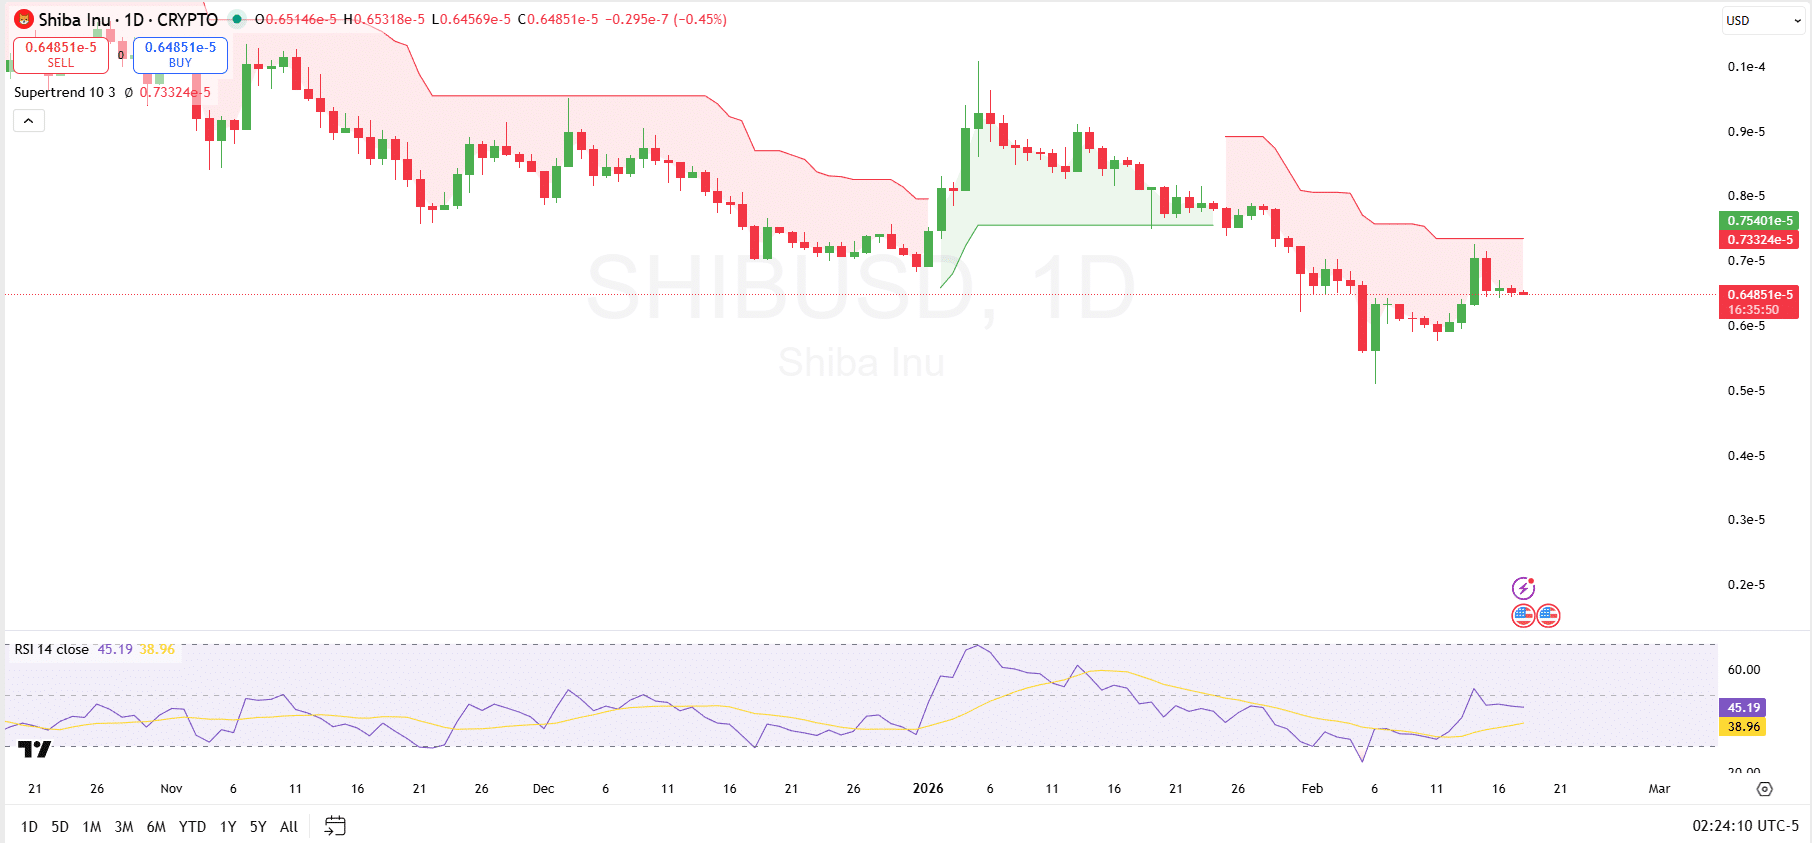
The Supertrend suggests that the price could be under pressure should it fail to reclaim this resistance level. If $SHIB can break above the resistance, it may be able to test higher levels, potentially moving toward $0.0000075, where additional resistance could be found.
On the support side, the $0.0000051 to $0.0000059 range is a critical zone, with $SHIB previously testing this area. If $SHIB fails to hold above this support range, a decline toward lower zones around $0.0000045 could be possible.
Looking at the Relative Strength Index, it currently stands at 45.19, suggesting that $SHIB is neither overbought nor oversold, remaining in neutral territory. This neutral reading indicates that there’s room for price movement in either direction. A potential bullish signal would come if the RSI crosses above 50, signaling increased buying momentum, while a drop below 40 could suggest bearish pressure.
Shiba Inu Futures Flows
The data from the flow analysis shows mixed results in Bitcoin’s futures and spot markets over various timeframes. In the short-term, the 30-minute and 1-hour inflows indicate a negative trend, with outflows surpassing inflows and showing net decreases in positions. The 30-minute timeframe, in particular, recorded a significant outflow of $58.37K, leading to a net inflow change of -224.15%.
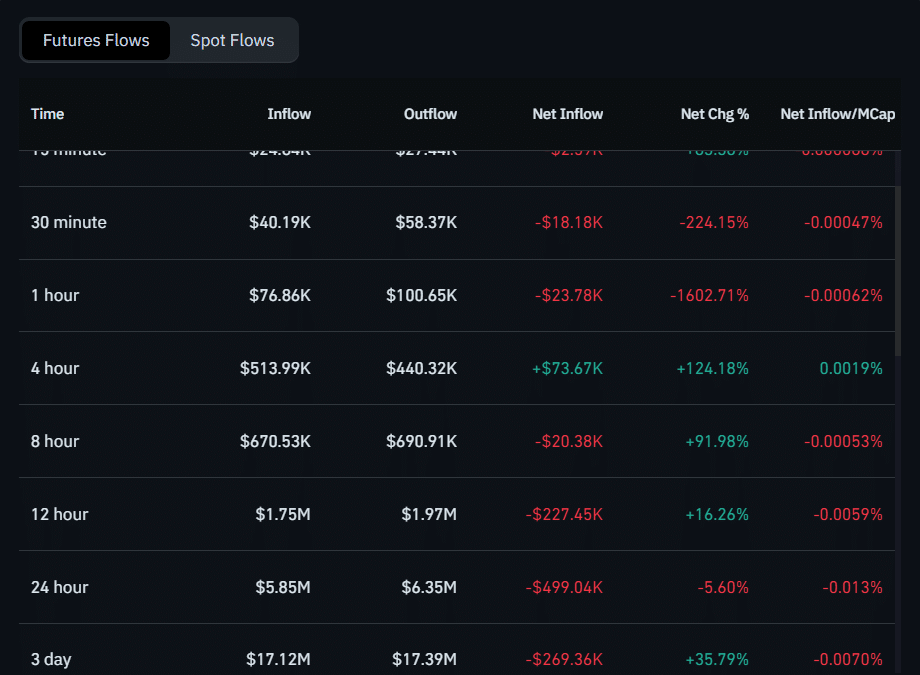
Similarly, the 1-hour data shows a negative shift in net inflow, dropping by 1602.71%. However, there is a noticeable rebound in the 4-hour and 8-hour periods. In the 4-hour timeframe, net inflows increased by 124.18%, reflecting positive market sentiment.
On longer time horizons, such as 12 hours, 24 hours, and 3 days, there is a mixed outlook. For example, the 12-hour and 24-hour data show modest outflows, with a 16.26% decrease in net inflows over 12 hours. On the other hand, the 3-day inflows show a recovery, with a net increase of 35.79%, suggesting renewed long-term optimism.

