


 15
15
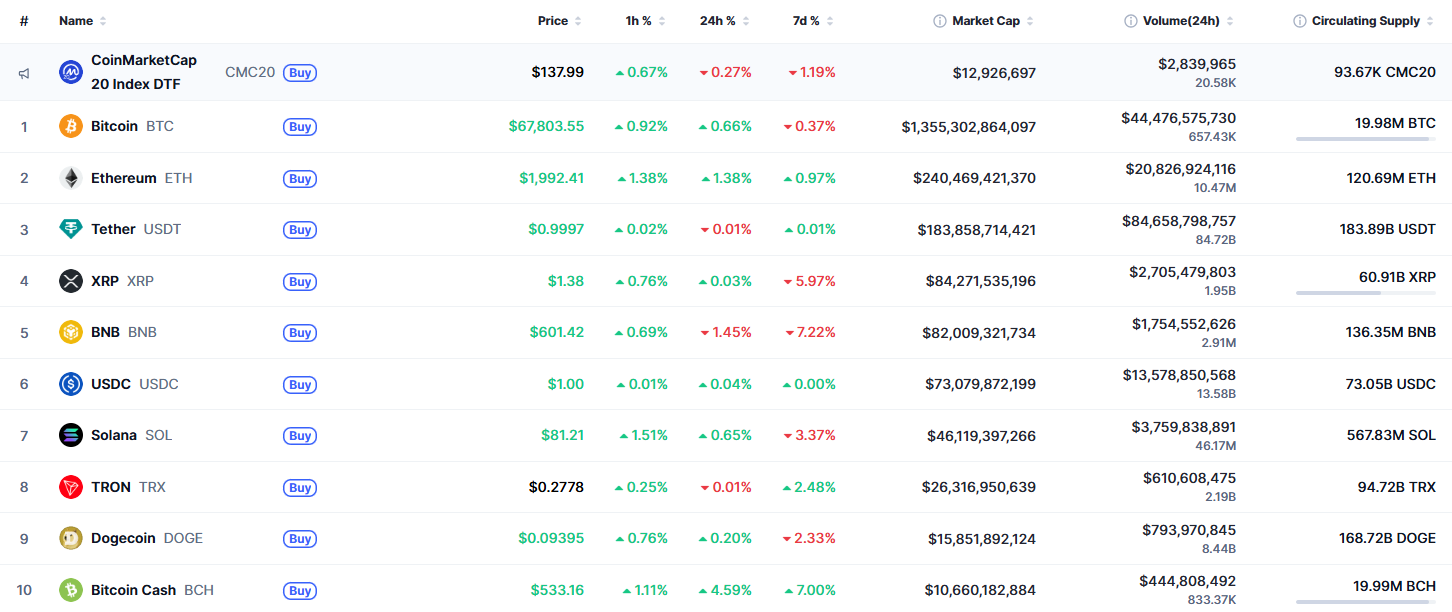
By the end of the week, some coins are coming back to the green zone, according to CoinMarketCap.
$SHIB/USD
The rate of $SHIB has risen by 1.6% over the last 24 hours.
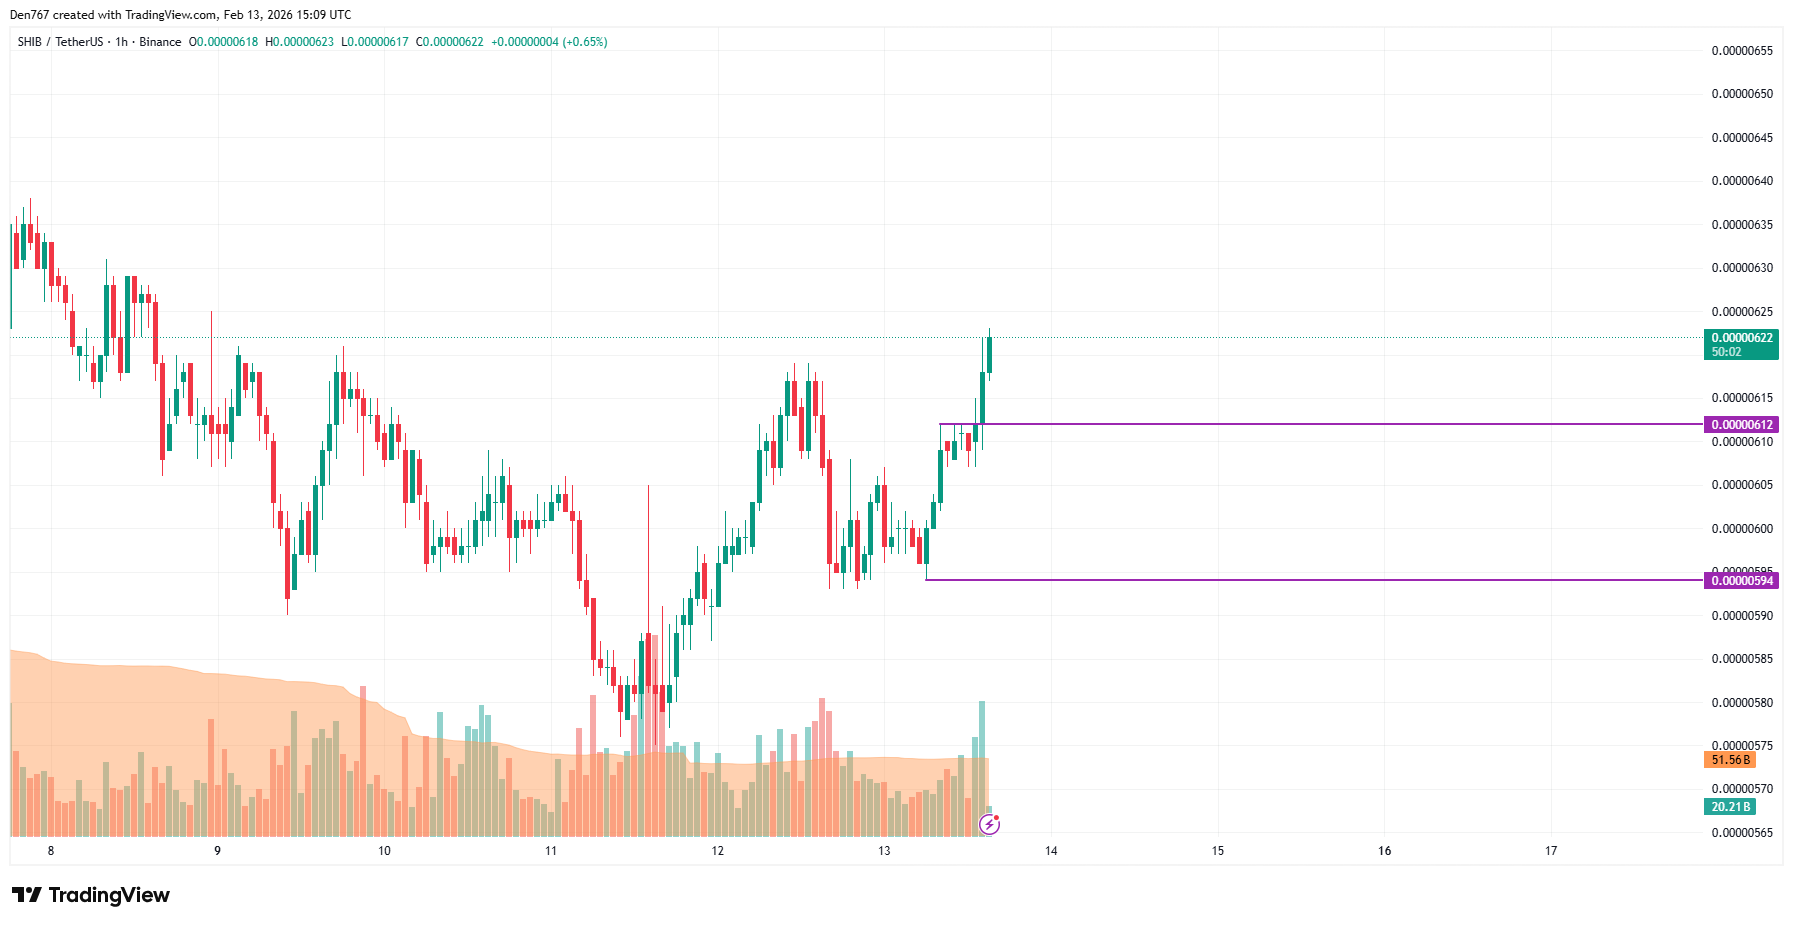
On the hourly chart, the price of $SHIB is going up after a breakout of the local resistance at $0.00000612. If bulls can hold the gained initiative, the upward move is likely to continue to the $0.00000650 range.

On the longer time frame, one should focus on the bar's closure in terms of the $0.00000642 level.
If the candle closes above it and with a short wick, the accumulated energy might be enough for ongoing growth to the $0.0000070 zone.
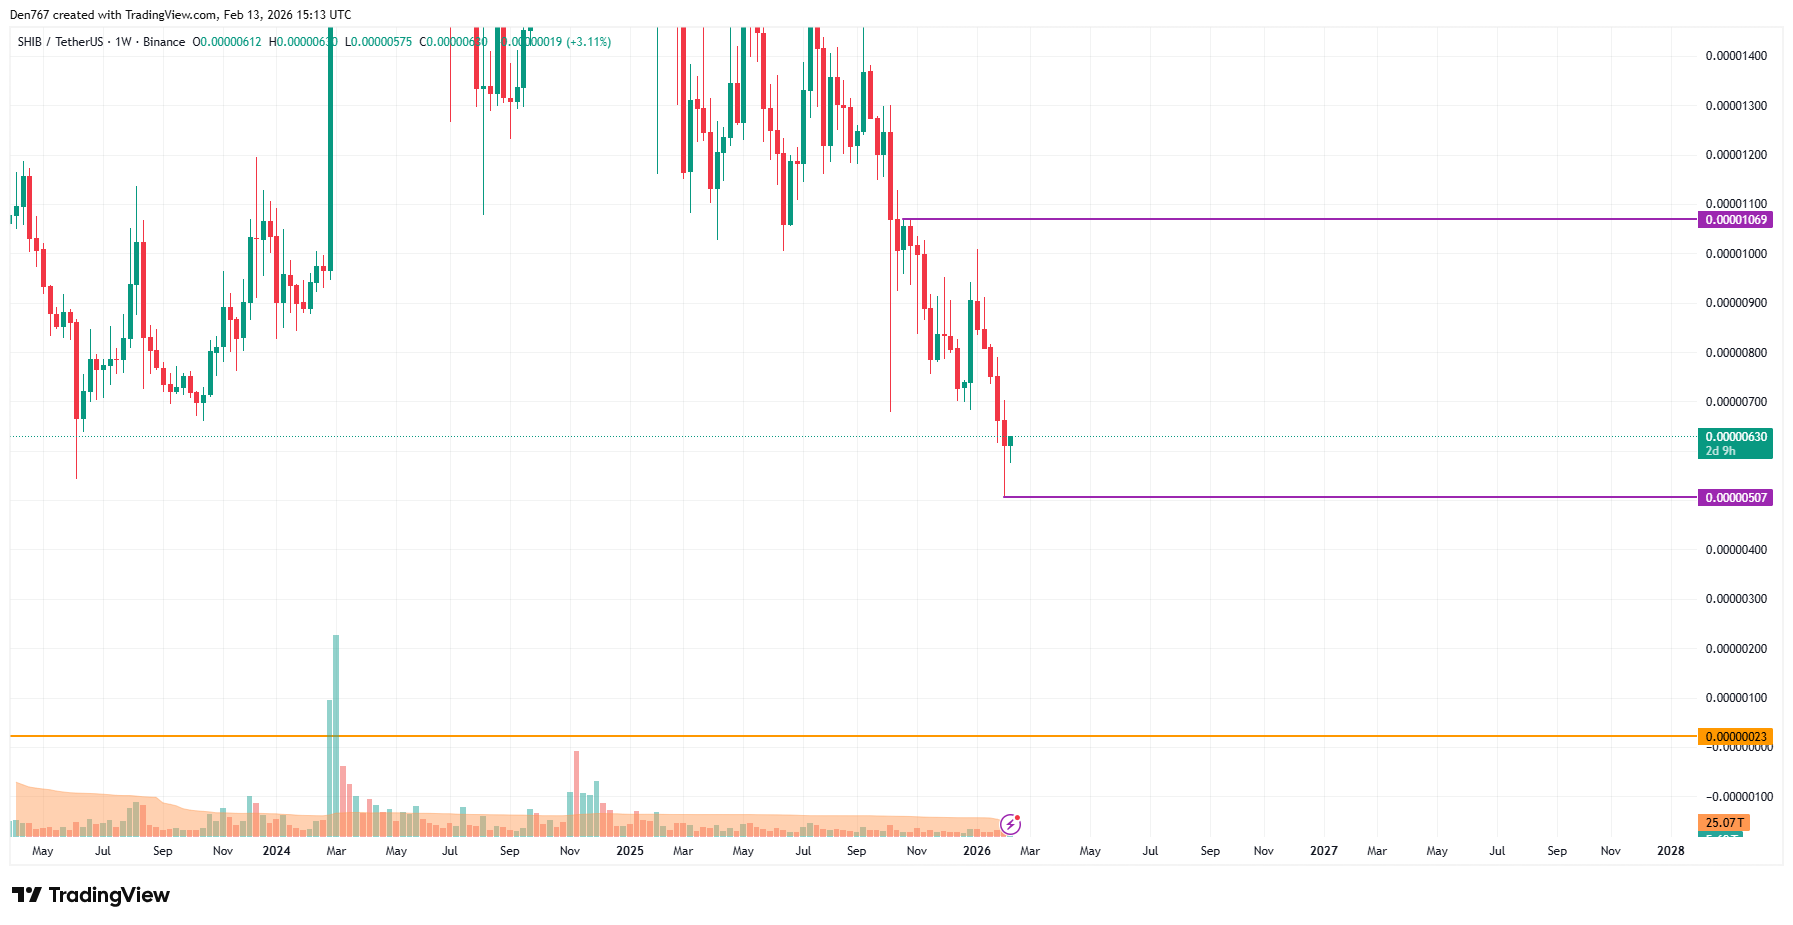
From the midterm point of view, the picture is less clear. The rate of $SHIB is far from key levels, which means traders might not witness sharp moves soon. All in all, sideways trading in the range of $0.0000060-$0.0000070 is the most likely scenario.
$SHIB is trading at $0.00000629 at press time.

