


 6
6
Solana wavers at key technical support as bearish momentum persists, with one analyst watching for a deeper breakdown.
Solana ($SOL) currently trades for $79.25, experiencing a 1.6% decline over the past 24 hours. Against Bitcoin, it is trading at 0.001193 BTC, down 0.8% on the day. The 24-hour price range spans from $76.81 (low) to $82.05 (high), showing a fairly wide intraday volatility.
Looking at the chart patterns, $SOL initially traded near the $80–$82 region before experiencing a sharp selloff, breaking below $78 and briefly dipping near the daily low around $76.81. Following that move, the price began a gradual recovery and is now hovering near $79. However, price has not yet reclaimed the earlier highs near $82, which remain immediate resistance.
Performance metrics across broader timeframes show mixed momentum. Over shorter intervals, $SOL is up 0.2% in 1 hour, but down 1.4% over 24 hours and 0.5% in the last 7 days, indicating short-term weakness. More notably, the asset is down 31.6% over 14 days and 45.3% over 30 days. These longer-term figures clearly reflect a significant macro drawdown phase.
The big question now remains: is this consolidation the base for Solana’s next leg up, or simply a pause before further downside?
What’s Next for Solana?
From a support and resistance perspective on the 1D $SOL/USD chart, price is currently trading around $79.72, after printing a recent low near the mid-$70s. The most immediate support sits in the $75–$77 region, which aligns with the recent swing low and the sharp wick rejection.
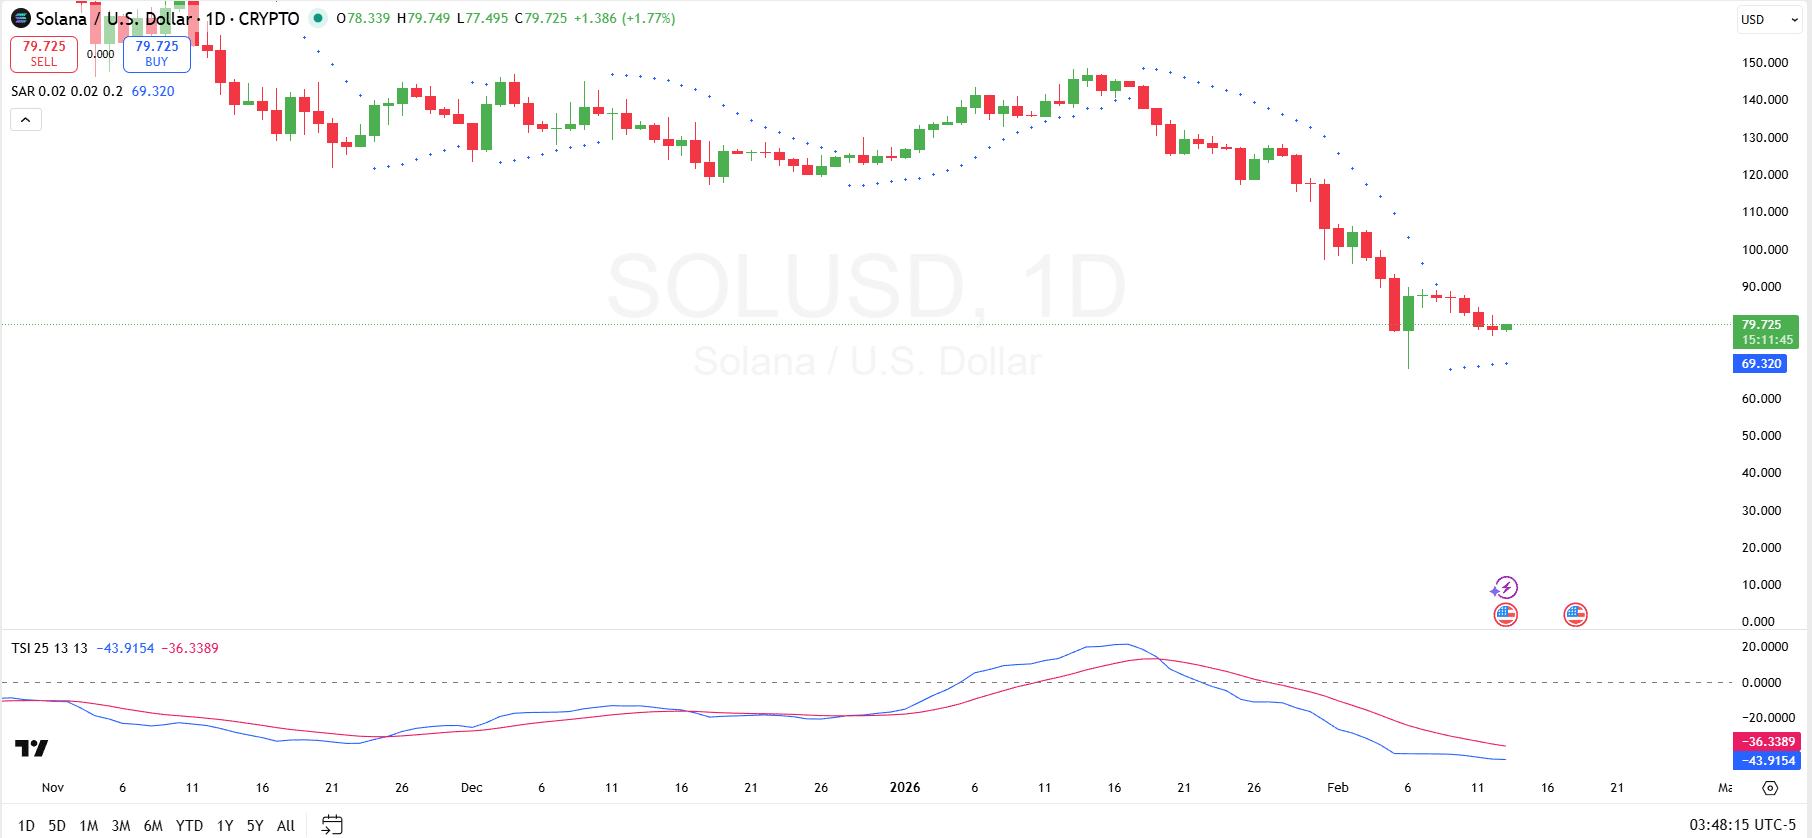
A breakdown below this area would likely expose psychological support near $70, which also aligns closely with the current Parabolic SAR. On the upside, immediate resistance has begun forming around $90, followed by a heavier supply zone between $100–$110. Looking at the Parabolic SAR itself, the dots have flipped below price following the recent rebound, with the current SAR reading around $69.32.
This shift suggests a potential short-term trend reversal or at least a pause in bearish momentum. However, the broader structure still reflects a clear daily downtrend, as the previous SAR alignment remained above price throughout the recent selloff.
The True Strength Index shows deeper insight into momentum conditions. The TSI line is currently around –43.91, with the signal line near –36.33, both deeply below the zero line. This confirms bearish momentum remains dominant. For stronger confirmation of a bullish shift, traders would want to see the TSI curl upward and cross above the signal line while the price holds above the Parabolic SAR and reclaims resistance levels.
Solana Going to $50?
Elsewhere, Altcoin Sherpa has warned that Solana could drop toward $50 if it loses the current support level, highlighting the critical zone around $75–$77. In the shared chart, $SOL is trading near $77.35 after a sharp rejection from above the 200-week EMA (around $121) and a strong breakdown from the $95 region.

The next major historical support sits near $51.23, which corresponds with prior consolidation and a former resistance-turned-support zone. If the $77 level fails, the chart structure suggests a potential vacuum lower toward that $50–$52 area, validating Sherpa’s downside scenario.