


 9
9
Solana trades below key trend resistance as momentum stabilizes, with traders watching whether weakening downside pressure can turn into a sustained recovery.
The Solana ($SOL) price action is flashing mixed signals as volatility tightens across the market, raising a key question about the near-term direction. $SOL is trading at $85.42, down 0.8% over the past 24 hours, with the daily range stretching from $82.99 to $88.27.
Market capitalization stands at $48.48 billion, while 24-hour trading volume reached $4.19 billion, pointing to sustained participation despite the pullback. On a relative basis, $SOL shows resilience against Bitcoin, gaining 0.9% versus $BTC, even as broader timeframes remain pressured, including -18.3% over seven days and -31.2% in the past 14 days.
With volatility compressing and relative strength against $BTC emerging, traders are now watching closely to see whether this range resolves into continuation or sets up the next decisive move.
What’s Next for Solana
Solana is currently trading under clear technical pressure, with $70–$83 acting as the immediate support zone on the 4-hour chart. This area has absorbed multiple pullbacks following the sharp sell-off that briefly pushed the price below $76, forming a short-term base. If this support fails, downside risk opens toward the $67 level, which aligns with the prior reversal area.
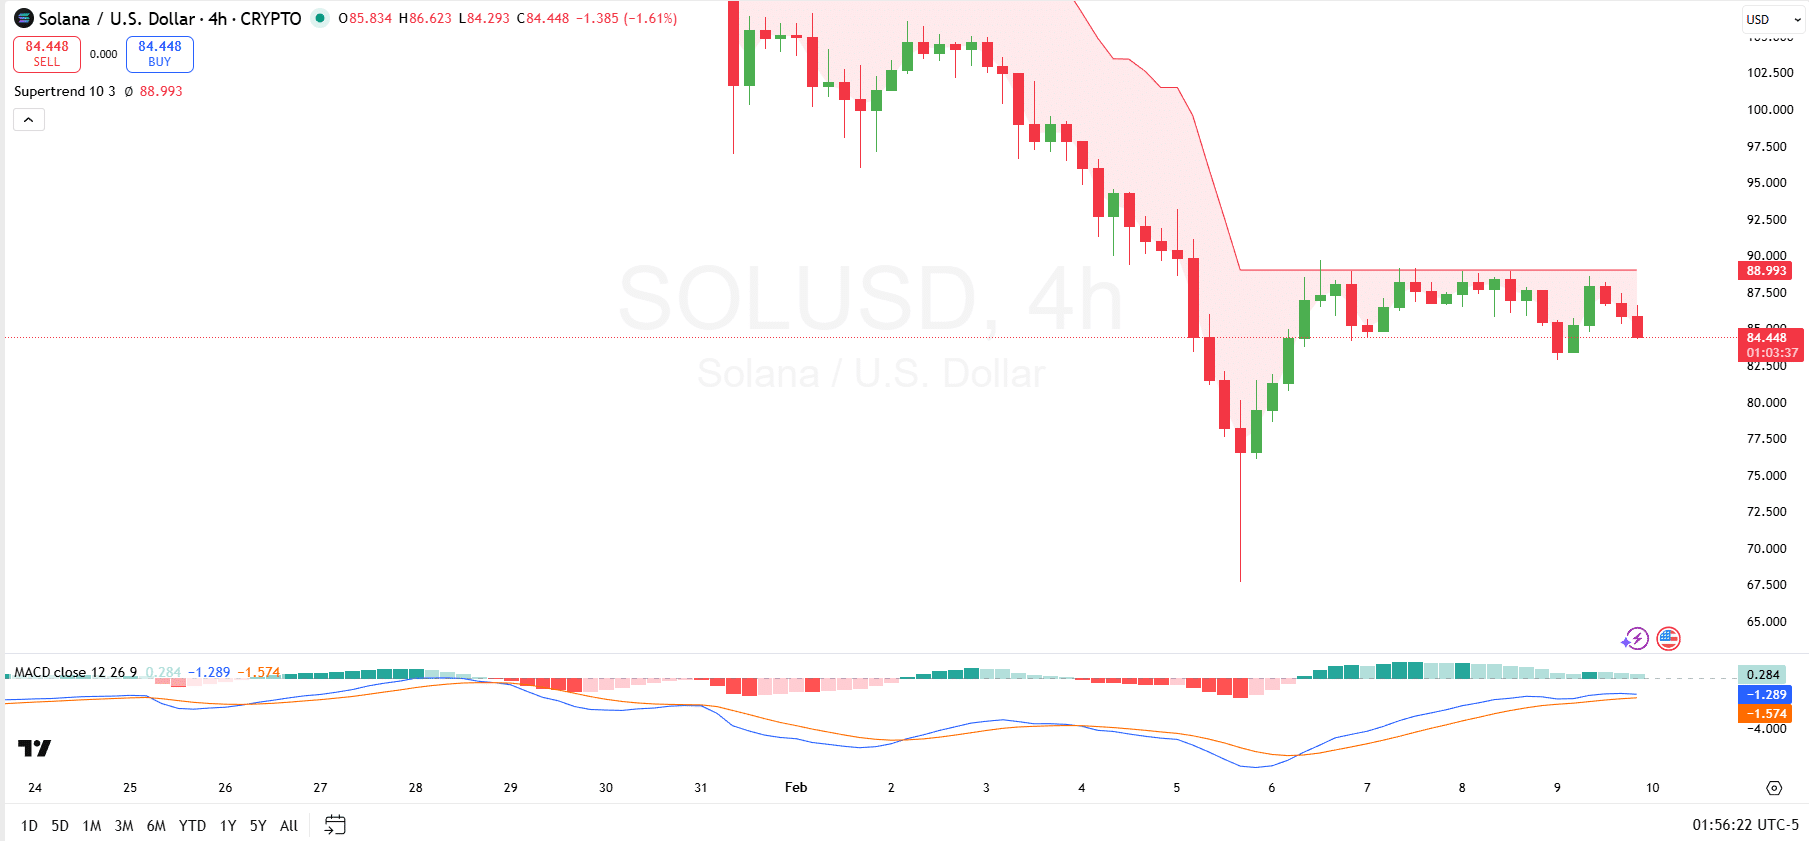
On the upside, resistance is firmly defined by the Supertrend, which sits near $88.99 and continues to cap recovery attempts. Price remains below this level, keeping the broader structure bearish. A sustained move above the Supertrend would be necessary to shift momentum and expose higher resistance zones around the $94–$98 area, where previous breakdowns accelerated selling pressure.
Meanwhile, momentum indicators show early stabilization. Specifically, the MACD remains below the zero line, with the signal and MACD lines still negative, though the histogram has started turning green, suggesting downside momentum is weakening. Also, the MACD line has finally crossed above the signal line, another positive signal.
Solana’s Bottom Signal?
Elsewhere, market intelligence firm Santiment reports that Solana ETFs recorded $11.9 million in net outflows on Feb. 6. This marked the second-largest single-day outflow on record, trailing only the December 3 figure.

Meanwhile, further data shows that over the past four months, $SOL has shed roughly 62% of its market capitalization, reflecting sustained selling pressure across both spot and institutional-linked products.
Santiment notes that this scale of capital exit often coincides with late-stage sell-offs, suggesting traders may be nearing capitulation territory. Historically, similar spikes in ETF outflows have aligned with market bottoms, as forced selling exhausts downside momentum and sets the stage for stabilization.