


 11
11
Cardano remains under bearish pressure as sellers cap rallies, while mixed futures flows signal caution despite short-term stabilization attempts.
Cardano ($ADA) is still in recovery mode, and the latest 24-hour tape shows buyers defending the lows, but failing to hold rallies for long. CoinGecko shows $ADA trading around $0.27, down 0.2% on the day.
The 24-hour range ran from $0.268 to $0.2751, a relatively tight band that still signals active two-way trading. Market activity remains decent, with $732.81M in 24-hour volume, albeit down by 30%.
Performance across timeframes underscores the broader trend. Over the last hour, Cardano has slipped 0.9%, although it remains up 0.2% across the past 24 hours. It also fell 3.4% over the last seven days and dropped 22.3% over the last 14 days.
Can Cardano Recover?
On the daily chart, the Ichimoku Cloud remains firmly bearish, as price stays below both the cloud and the baseline, while the cloud ahead is thickening and sloping downward. This structure typically signals sustained downside pressure and highlights strong overhead resistance in the $0.38 zone, where the conversion and base lines start diverging.
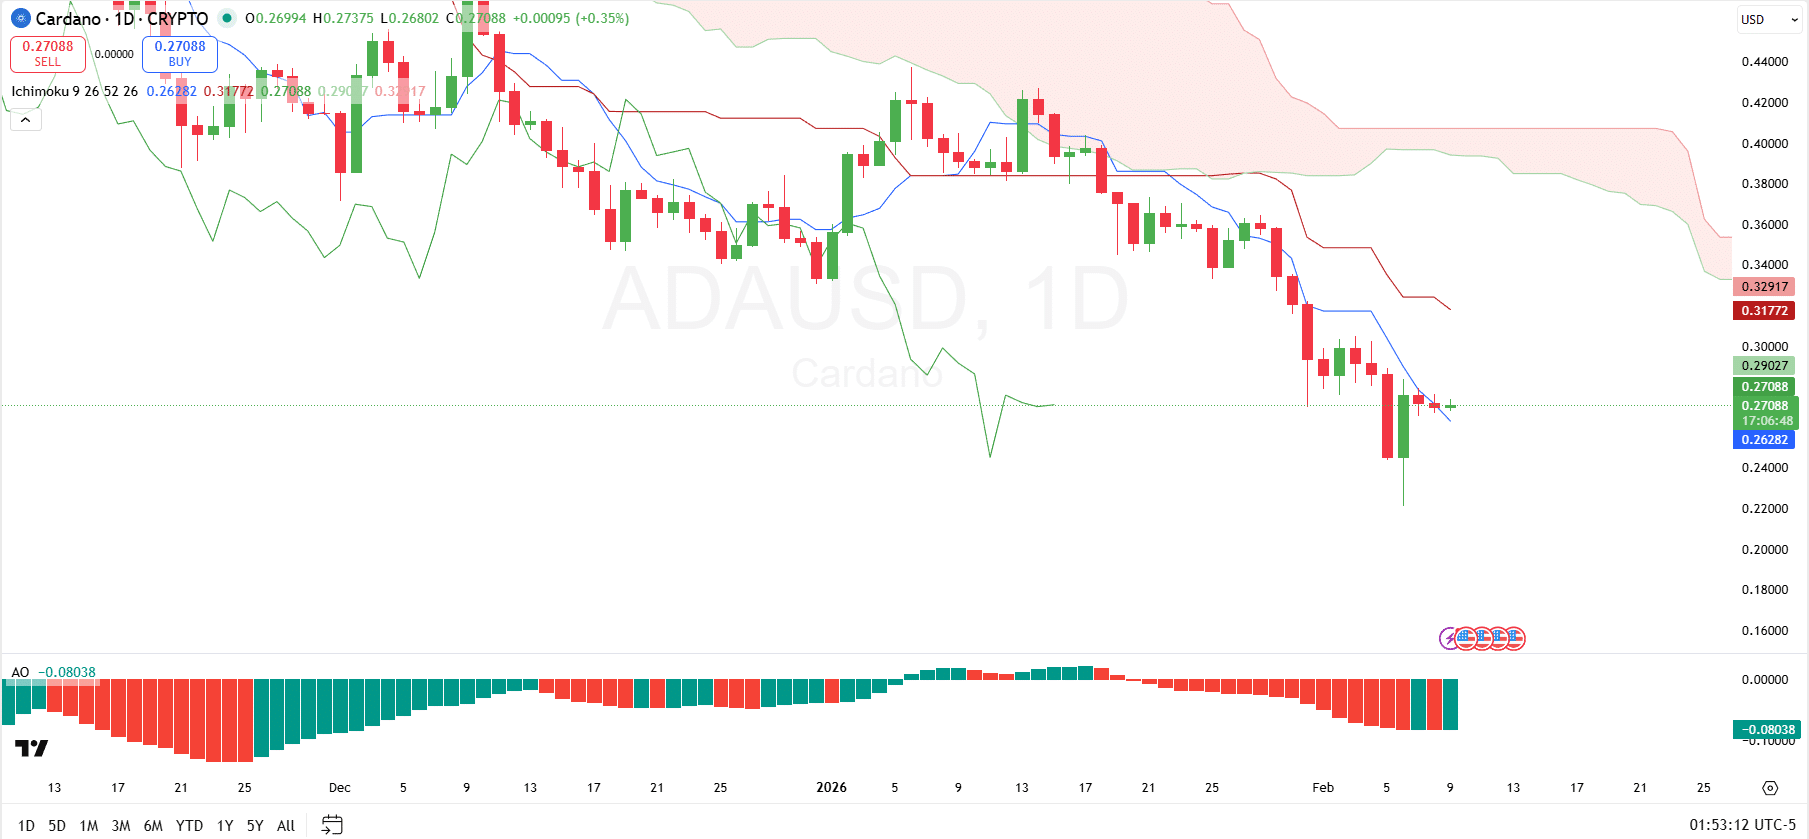
Short-term momentum also shows continued weakness. The conversion line has crossed below the baseline and is tracking prices lower. Meanwhile, the lagging span sits well below prior price action, confirming that current price levels remain weaker than historical ranges. Immediate support forms around the $0.24–$0.26 area, which has absorbed recent selling pressure. However, any loss of this zone would expose $ADA to deeper downside risk.
Momentum indicators align with the bearish trend. Specifically, the Awesome Oscillator is deep in negative territory, printing red histogram bars, although a green one has appeared at the end. For the outlook to improve, prices would need to reclaim key Ichimoku levels and flip momentum indicators higher.
Cardano Futures Flows
Cardano futures flow data shows mixed positioning across short timeframes, suggesting traders remain reactive rather than committed to a clear directional bias. Over the 15-minute window, a net inflow of $114.04K was seen, indicating a brief return of bullish positioning as bullish traders stepped back in.
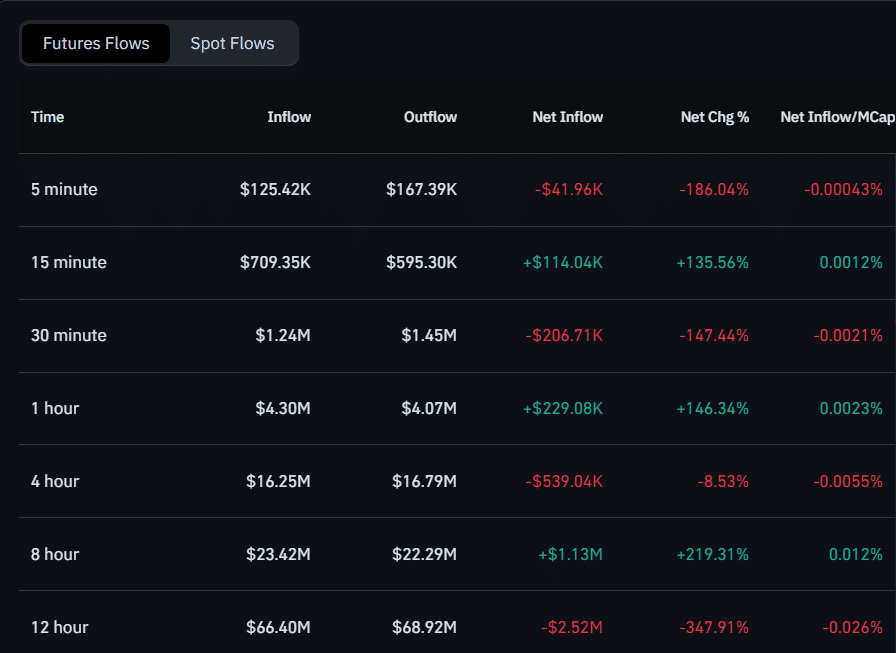
The 30-minute window flipped bearish again, with a $206.71K net outflow. In contrast, the 1-hour timeframe recorded a net inflow of $229.08K, suggesting some traders were willing to add exposure on slightly longer horizons.
Looking further out, the 4-hour window showed a net outflow of $539.04K, reinforcing caution among swing traders, while the 8-hour timeframe showed a net inflow of $1.13M. However, that optimism faded again on the 12-hour window, which posted a net outflow of $2.52M, signaling renewed defensive positioning.
