


 12
12
$XRP has dropped to its most oversold level on the daily, weekly, and monthly charts amid the ongoing broader market downturn.
Interestingly, the recent development occurs while $XRP has maintained a price above the psychologically important level of $1 despite the latest wave of bearish pressure. For context, the recent selloffs have led to the loss of $369 billion in the global crypto market cap, on track to mark the largest weekly loss since March 2025.
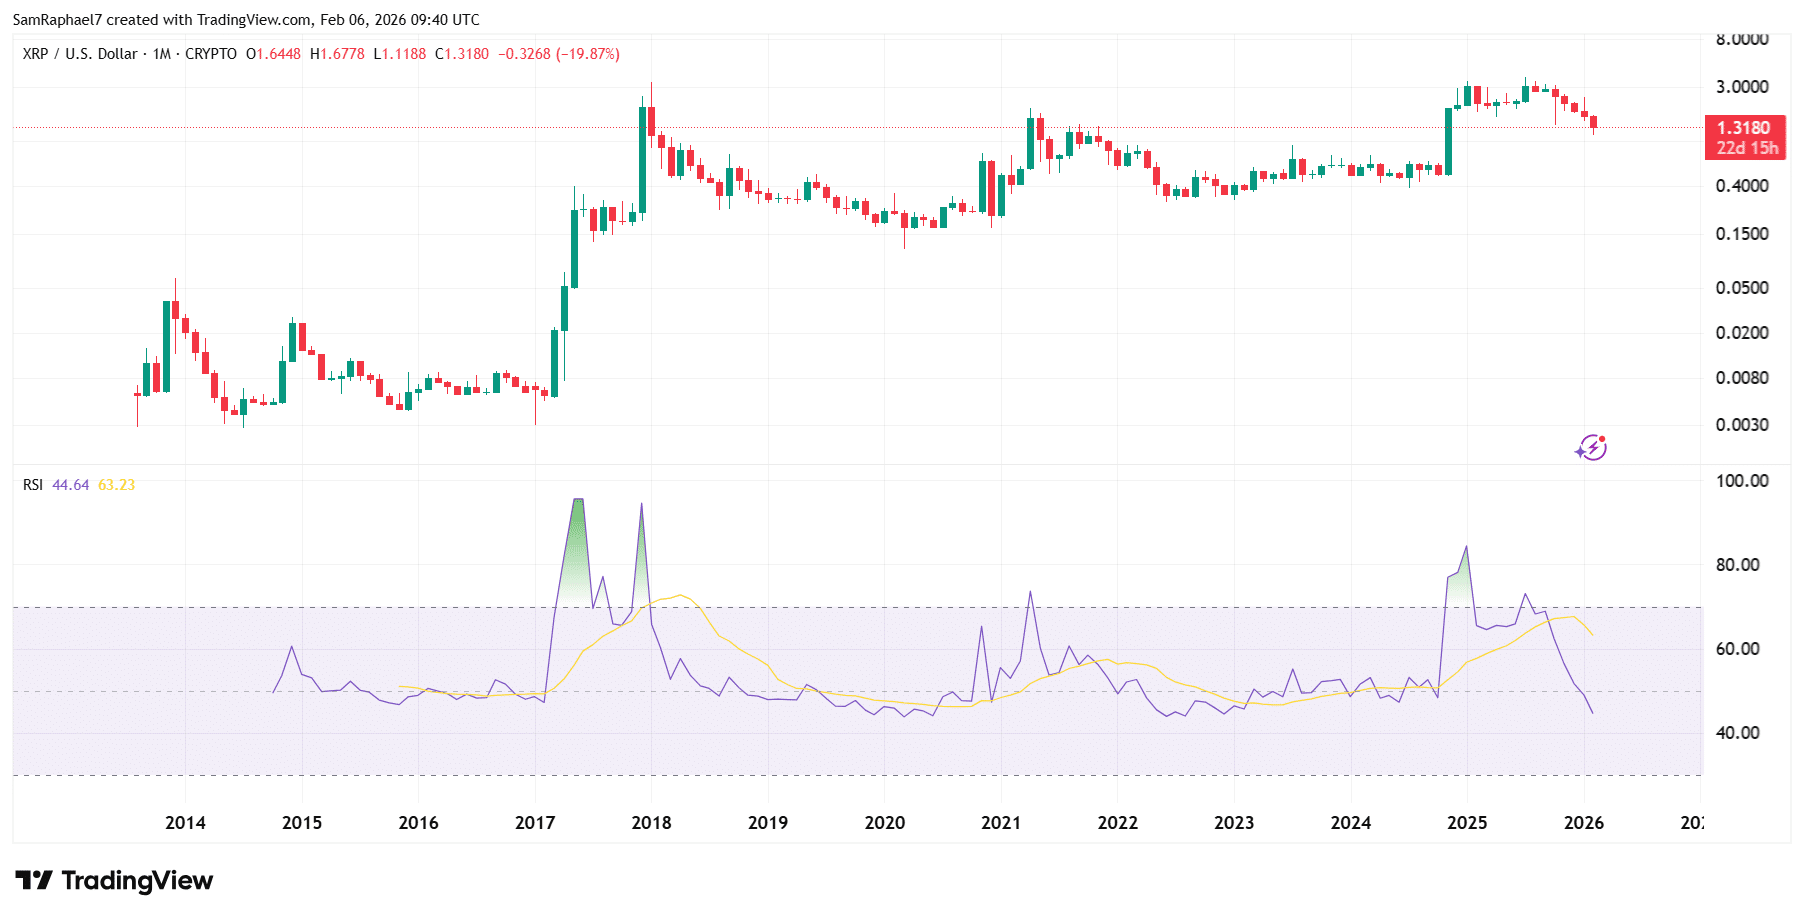
Amid this downturn, $XRP has lost over $18 billion worth of market value this week, down nearly 19% within this period. Notably, prices have dipped below the $1.5 and $1.4 levels, now battling at $1.3. With the latest crash, $XRP has now reached its most oversold level in history across the daily, weekly, and monthly timeframes.
Key Points
- Crypto has witnessed another wave of bearish pressure, leading to the loss of $369 billion worth of valuation in the global market this week.
- $XRP contributed $18 billion to this loss, as its price drops below the $1.5 and $1.4 levels, now battling the bears at $1.3.
- Amid the latest crash, $XRP has now dropped to its most oversold level in history across multiple timeframes, leading to extremely low readings on momentum indicators.
- These extreme readings often indicate that selling pressure is close to an end, and the market may be due for a rebound.
$XRP Collapses Alongside the Broader Crypto Market
Market analyst CryptoBull first spotlighted this development as bears take full control of the market in what appears to be the steepest short-term decline since the 10/10 crash. Specifically, the global crypto market cap lost $311 billion in a single day yesterday, representing its largest intraday loss since Oct. 10, 2025, when $383 billion left the market.
This downturn impacted the entire market, with $XRP dropping 19.71% yesterday, marking its steepest intraday decline in five years. For context, this intraday drop was larger than the Terra-led drop on May 11, 2022 (-19.14%), the FTX-inspired collapse on Nov. 9, 2022 (-18.21%), and the Oct. 10, 2025, crash (-15.41%).
$XRP Hits Its Most Oversold Level in History
With this decline, $XRP now battles the bears at the $1.3 support level, having lost the $1.4, $1.5, and $1.6 regions. Interestingly, CryptoBull found that the current downtrend has now pushed $XRP to its most oversold level on the daily, weekly, and monthly charts. Notably, this would pertain to the RSI momentum indicator.
Specifically, the RSI on the daily chart has dropped to 17.07 on Thursday amid the 19.71% price crash, representing its lowest value in ten years. Meanwhile, on the weekly chart, the RSI dropped below 28, marking the lowest reading in $XRP’s history.
For the monthly timeframe, RSI dropped to 44, representing the lowest level in years. Crypto Bull called attention to the fact that these low RSI readings have emerged while $XRP continues to hold above $1. Notably, if a rebound occurs from here, prices could reach new heights.
2-Week RSI Also Down
Interestingly, market analyst EGRAG Crypto confirmed that this trend also spilled into the 2-week timeframe, where $XRP’s RSI dropped to its lowest level in history. According to EGRAG, such extreme readers typically indicate that the selling pressure that has dominated the market may be facing exhaustion.
Generally, this trend indicates extreme overselling and heavy downside pressure. It often precedes a relief bounce or trend slowdown as sellers exhaust, but it can also reflect strong bearish momentum if broader market sentiment stays weak. According to EGRAG, the market structure would decide the next move, whether up or down.