


 7
7
Solana price has dropped for four consecutive weeks and is now trading at a crucial support level despite the soaring network metrics during the ongoing crypto winter.
- Solana price dropped below the neckline of the head-and-shoulders chart pattern.
- Spot $SOL ETFs have added over $6.8 million in inflows this month.
- Solana’s transactions and active addresses have soared in the past few weeks.
The Solana ($SOL) token dropped to $93, down nearly 70% from its January 2025 high. It has dropped to the lowest level since February 2024.
The ongoing crash occurred even as third-party data showed that spot Solana ETF inflows continued rising and its network growth accelerated. Data compiled by SoSoValue shows that spot Solana ETFs added $1.24 million on Tuesday after adding $5.58 million on Monday.
These funds have now added $6.8 million in assets this month, bringing the cumulative inflows to over $877 million. Solana ETFs now hold over $854 million in assets, which is equivalent to 1.5% of its market capitalization.
Nansen data shows that Solana has become one of the fastest-growing networks in the cryptocurrency industry. Its transactions rose by 43% over the last 30 days to over 2.48 billion, surpassing the combined transactions of other networks.
Solana’s network had over 105 million addresses in this period, up by 81%. Its active addresses are much more than those of other chains combined. For example, Ethereum had over 15 million active addresses, while BNB Chain had 41.2 million.
Solana’s network fees jumped by 94% to over $26 million, much higher than Ethereum’s $15 million. It is closing the gap with Tron, which made $29 million in the same period.
One main reason for the network’s growth is its stablecoin transactions. It had over $491 billion in stablecoin volume over the last 30 days, with most of it in USDC. Its stablecoin transactions rose to over 305 million, with addresses reaching 5.2 million.
Solana price has formed a risky chart pattern
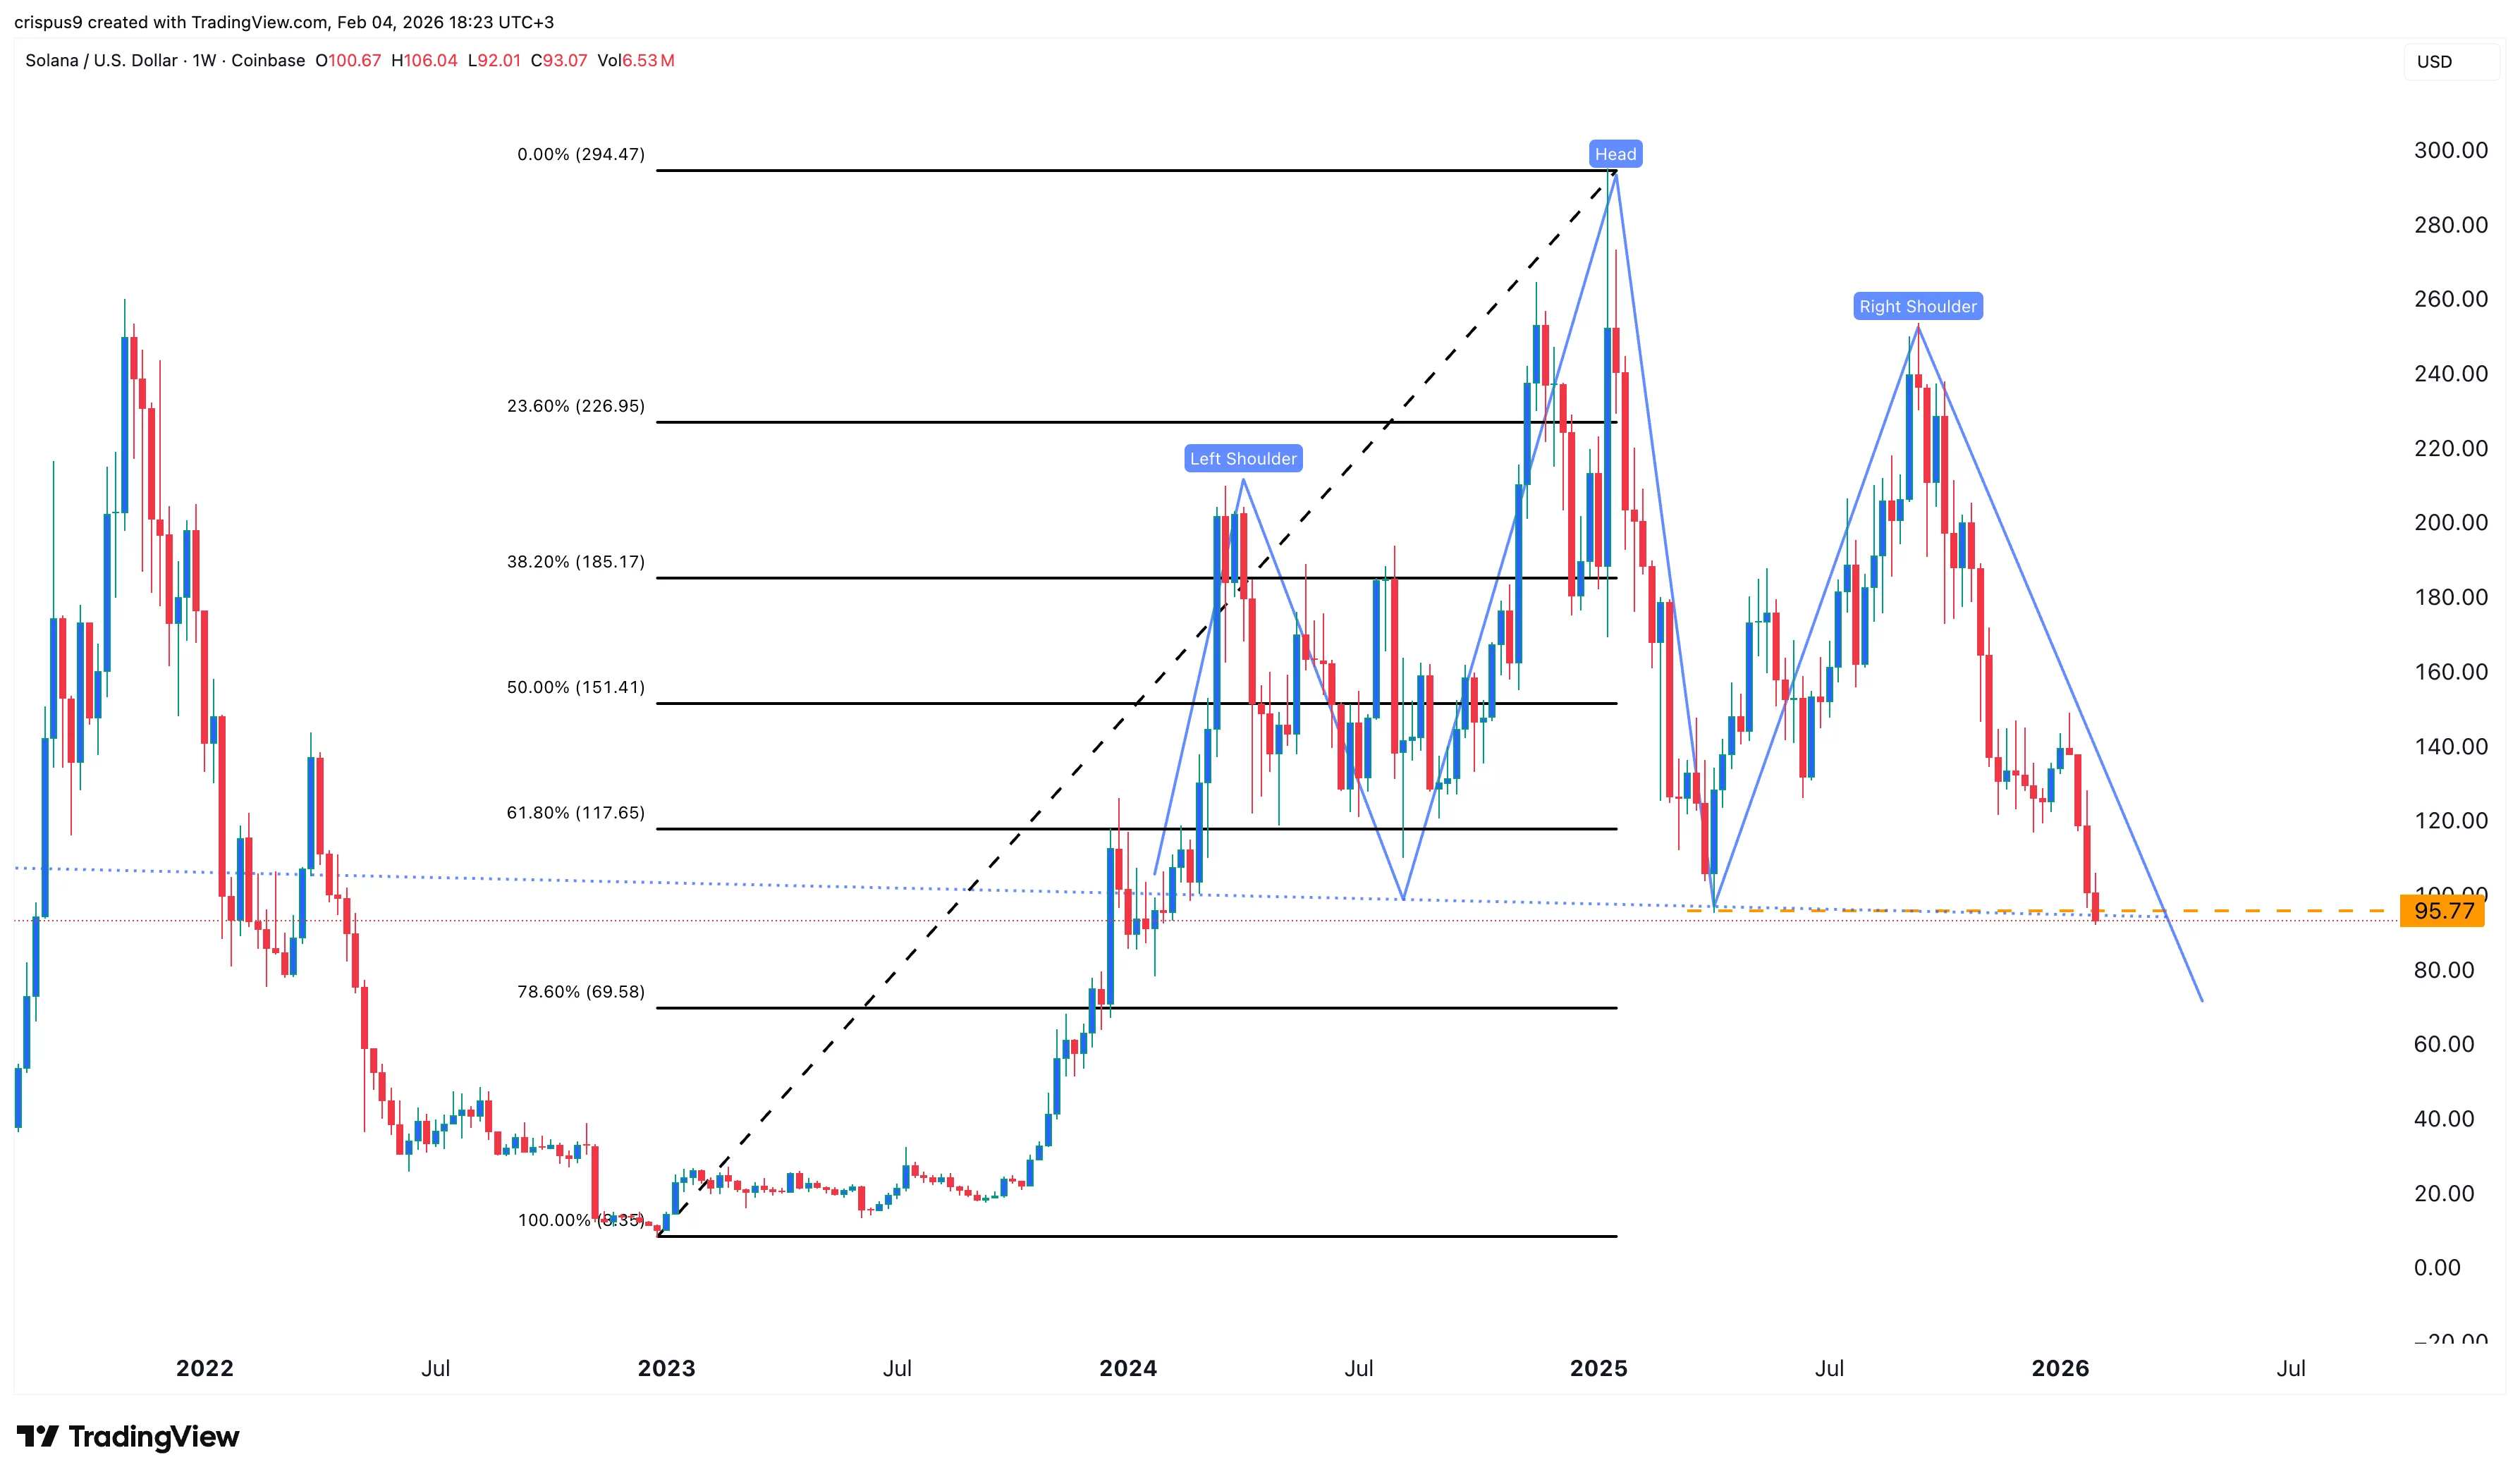
The weekly chart shows that Solana token has crashed in the past few months, moving from a record high of $295 in January last year to the current $94.
Solana has formed a head-and-shoulders pattern and is now trading at the neckline. A break below this neckline will signal further downside, potentially to the key support level at $70, which is near the 78.6% Fibonacci Retracement.
A move above the 61.8% Fibonacci Retracement level at $115 will invalidate the bearish outlook.

