


 13
13
Bitcoin ($BTC), Ethereum ($ETH), and Ripple ($XRP) remain under pressure, with the leading cryptocurrencies recording losses since the start of the week.
Bitcoin fell to its lowest level since early November 2024, to $72,945, following Tuesday’s selloff.
$ETH and $XRP, following $BTC’s lead, extended their losses, with Ether hitting a seven-month low while $XRP retested the $1.50 support level.
$XRP retests $1.50 as market conditions remain bearish
Copy link to section
$XRP, the native coin of the Ripple ecosystem, is down by less than 1% in the last 24 hours and is now trading at $1.60 per coin.
It has slightly recovered after retesting the $1.50 support level on Tuesday.
Analysts believe that the bearish performance could persist due to the prolonged volatility and low liquidity within the market.
In an email to Invezz, Tony Severino, market analyst at YouHodler, stated that Bollinger Bands on the monthly chart are the tightest they have ever been, reflecting an extreme level of volatility compression.
At the same time, Bitcoin continues to trade below the monthly basis line, with only days left before a monthly close that would confirm acceptance beneath it.
Ripple’s $XRP is following Bitcoin’s pattern on the weekly and monthly charts.
“Historically, sustained closes below the monthly Bollinger basis have often preceded capitulation-style moves in the months that follow. This does not guarantee immediate downside, but it reinforces the idea that time is being compressed rather than trend resolved. When volatility finally expands from these conditions, the resulting move has tended to be decisive — and markets rarely give ample warning once that expansion begins,” Severino added.
The analyst pointed out that the broad altcoin indexes continue to lag Bitcoin, with total market cap measures struggling to reclaim former support levels.
Technically, this reflects caution rather than capitulation, as many altcoins remain range-bound with declining volatility. In this phase, beta exposure tends to underperform selectivity.
$XRP could retest the $1.44 support level in the near term
Copy link to section
The $XRP/USD 4-hour chart is bearish and inefficient, with the efficiency gap at $1.71 yet to be tapped.
The recent bearish performance comes after $XRP’s price closed below the daily support at $1.83 last week, losing more than 15% of its value since then.
If the bearish trend persists, $XRP could likely retest the lower trendline boundary of the falling wedge pattern around $1.44 over the next few hours or days.
An extended bearish performance would see $XRP decline further towards the weekly support level at $1.30.
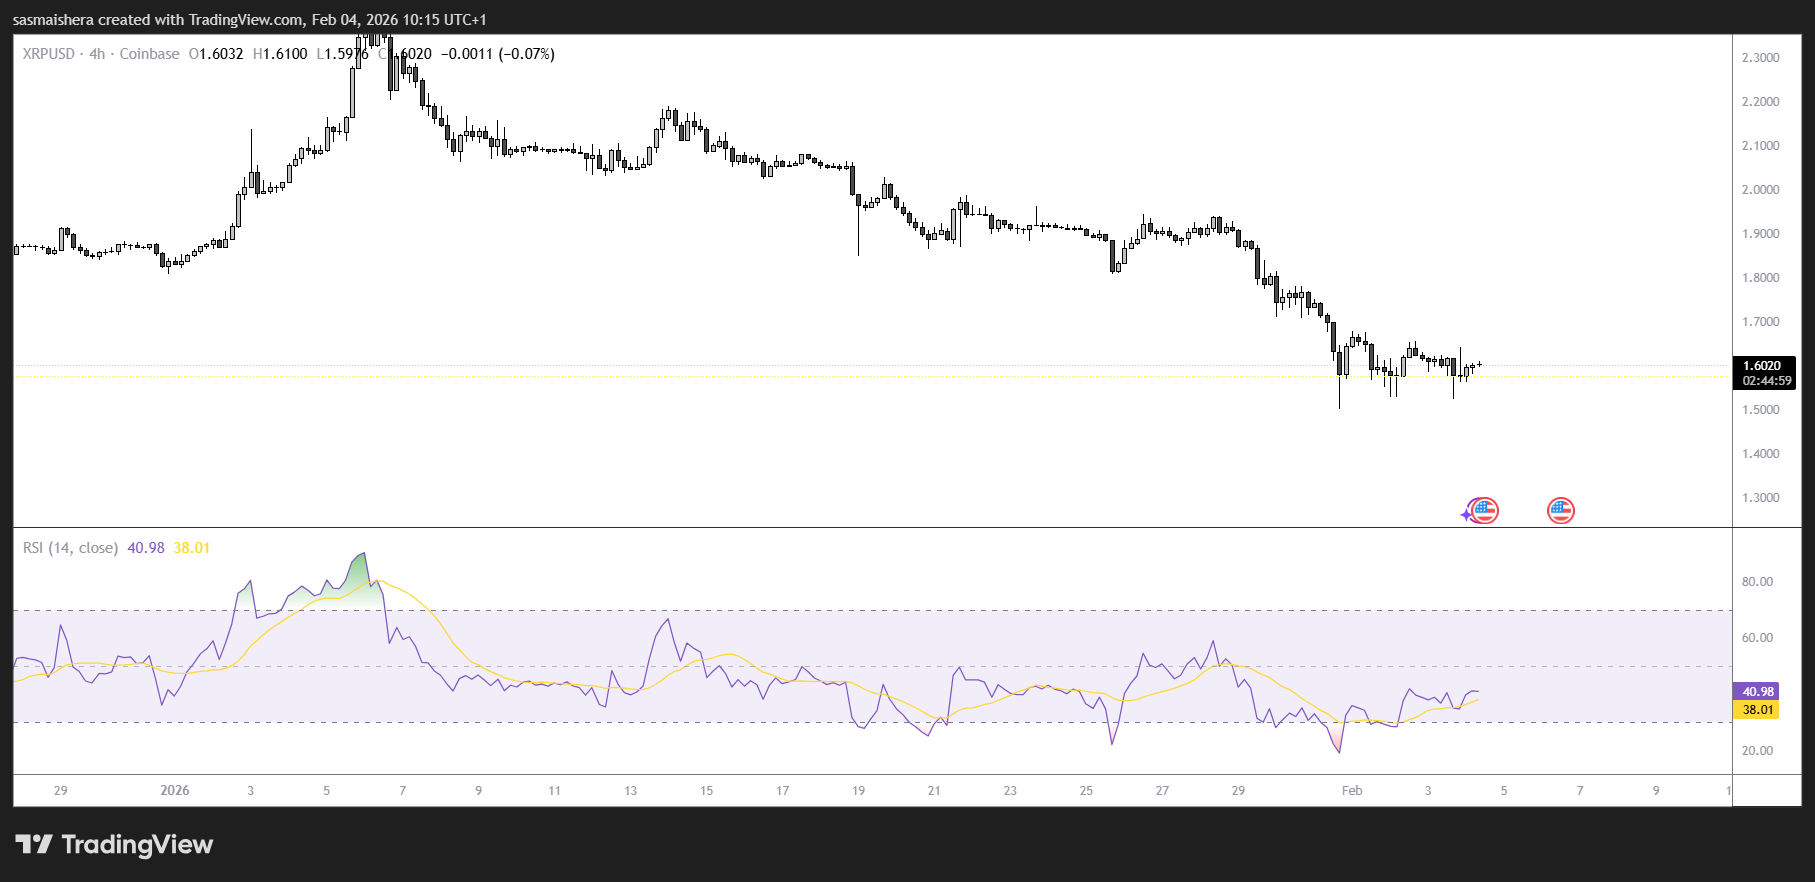
Similar to Bitcoin and Ethereum, $XRP’s momentum indicators (RSI and MACD) are also projecting a bearish outlook.
However, if the $1.50 support level holds and $XRP bounces back, it could extend its recovery towards the support-turned-resistance level at $1.83.