


 10
10
The $XRP MACD indicator has recorded its lowest histogram reading in history, signaling increased bearish pressure but potential for reversal.
Notably, this recent development emerged on the $XRP monthly chart amid $XRP’s recent decline below the $1.6 support level. For context, $XRP’s struggles intensified after the asset hit $1.91 on Jan. 29, as increased bearish pressure eventually pushed prices below $1.6 on Jan. 30 for the first time since November 2024.
With a 3.39% drop in February 2025, $XRP is now on track to record a fifth consecutive monthly candle loss for the first time since 2016. This sustained downward pressure has now led to a collapse in the February monthly MACD histogram, reaching -0.1234, its lowest reading in history.
Key Points
- Since late January, $XRP has witnessed intensified bearish pressure, dropping from $1.91 to a low below $1.6 for the first time since November 2024.
- The downward pressure spilled into the new month, February, leading to a 3.39% drop, as $XRP pushes toward a fifth consecutive monthly loss.
- Amid this consistent price downturn, the $XRP MACD has recorded a monthly histogram of -0.1234 in February, the lowest in history.
- Such a low histogram reading confirms the intensity of the selling pressure, indicating that $XRP has entered an extreme bearish condition.
- It also indicates that $XRP may now be massively oversold, potentially reversing the current downward trend for a rebound.
$XRP Price Struggles
This development was recently spotlighted by Chart Nerd, a well-regarded market commentator, as $XRP continues to battle the bears under important support levels. Notably, after losing the $2 support on Jan. 18, $XRP also relinquished $1.9, $1.8 and $1.7 between Jan. 29 and Feb. 1.
Now, the asset is struggling to hold the $1.6 area, currently trading just below it at $1.59. With an over 3% decline in February so far, $XRP has collapsed 44% since October 2025. Also, the crypto asset is on track to record five consecutive monthly losses for the first time since late 2016.
$XRP MACD Histogram Sees Record Low
Interestingly, the February drop has translated to a crash in the $XRP MACD histogram on the monthly chart. Notably, Chart Nerd pointed out that the MACD histogram reading recently collapsed to -0.1234. For perspective, this represented the lowest recorded reading for the $XRP MACD on the monthly chart.
Previously, the lowest reading was -0.0822, recorded in August 2022, amid the price downturn that dominated the market following the May 2022 Terra ecosystem crash.
Notably, this aligned with the bottom of the 2022 bear market at $0.28, with $XRP seeing a mild recovery shortly after. Since then, $XRP has not revisited the $0.28 price. With the MACD histogram collapsing to an even lower level this month, analysts like Chart Nerd believe a similar recovery push could ensue, but the trend may not be so straightforward.
What Does the $XRP MACD Reading Mean for Price?
For the uninitiated, when the MACD histogram sinks deeply into negative territory, it shows that sellers firmly control the market. With $XRP, the latest extreme reading indicates that downward pressure has intensified beyond anything seen in past cycles.
When the histogram stays deeply negative, the natural reading is that bearish pressure has intensified; it doesn’t necessarily point to an automatic rebound in the near-term. This suggests $XRP still has the potential to face more downside or extended consolidation before finding a stable bottom.
However, extreme readings can also suggest that selling has reached exhaustion. The market typically becomes oversold during heavy declines, which can trigger short-term relief rallies as traders step in to buy at lower prices. Nonetheless, this remains uncertain. Also, with February still in play, the MACD histogram could pick up before the month ends.
Historical Data Highlights Important Caveat
Historical data confirms the need for investors to be cautious. As earlier highlighted, the extreme negative MACD reading in 2022 aligned with $XRP’s bottom for the bear market, with prices seeing mild rebounds following the reading.
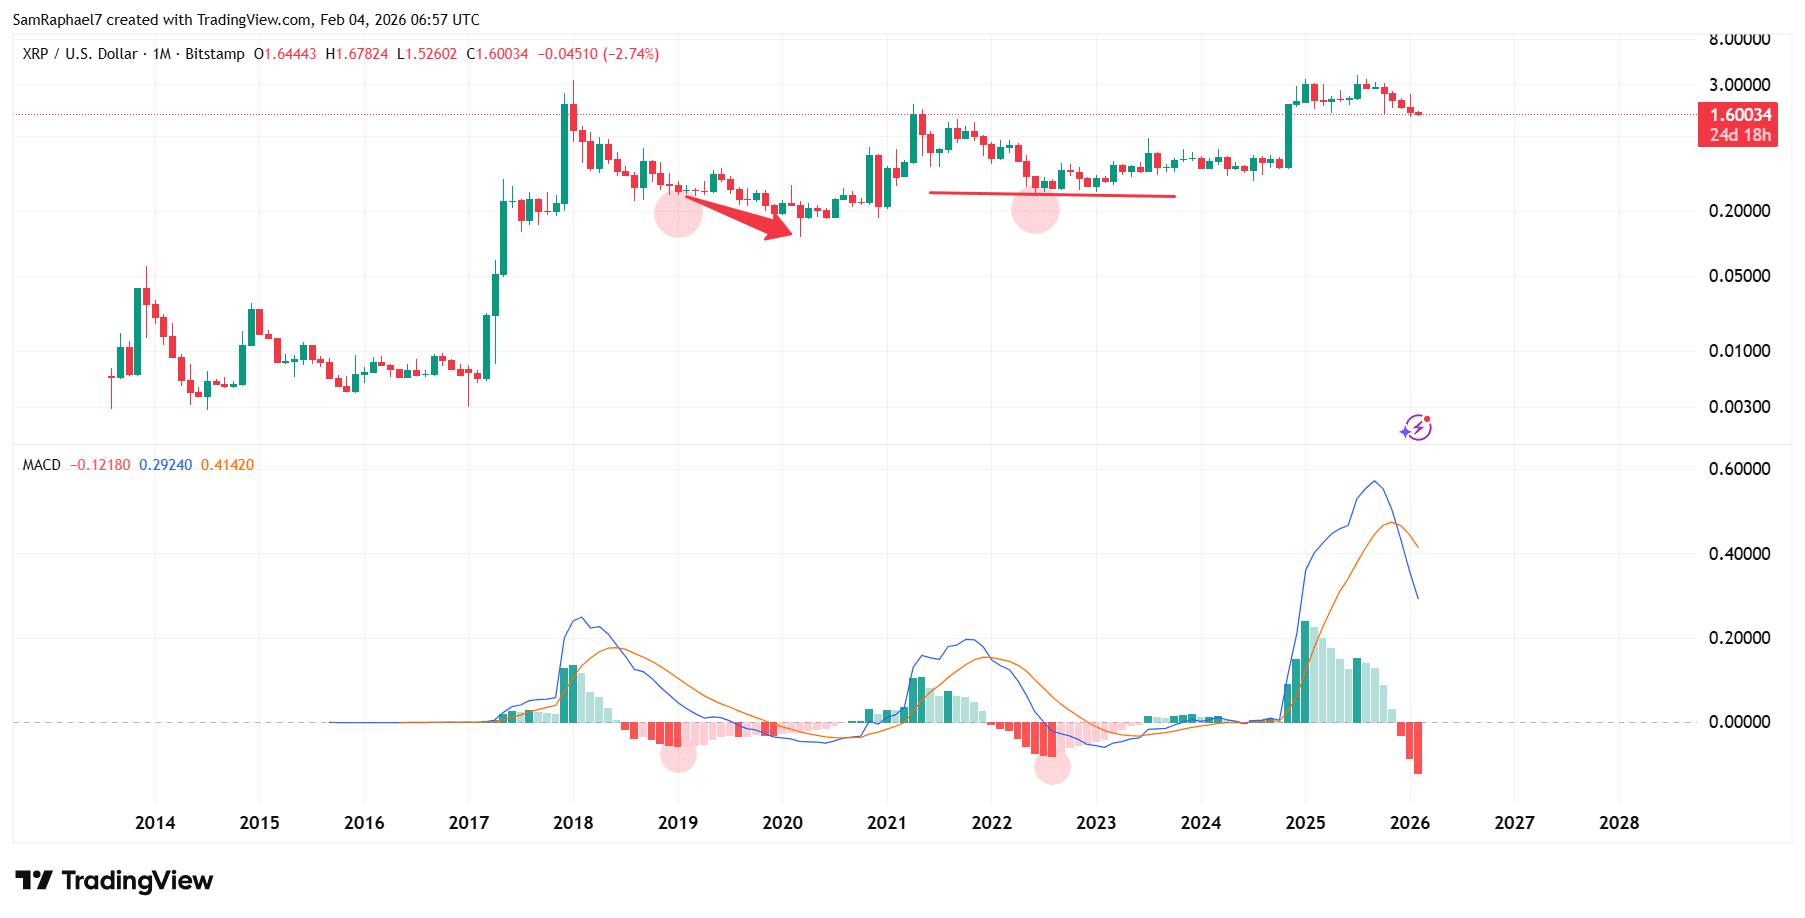
However, another extreme negative reading of -0.0579 in January 2019 did not align with the bottom of that cycle. Specifically, after the reading, $XRP still saw sustained declines despite the MACD histogram witnessing a recovery. Notably, after the negative MACD, $XRP still dropped from $0.2779 to a lower low of $0.1746 in December 2019 before finding a bottom.
