

 5
5
Shiba Inu price today trades near $0.00000685 after recovering from a session low at $0.0000062 that marked the token’s lowest level since late 2024. The bounce comes as derivatives traders rebuild positions, though declining burn activity suggests community engagement has weakened during the broader meme coin selloff.
Open Interest Rises As Traders Rebuild Positions
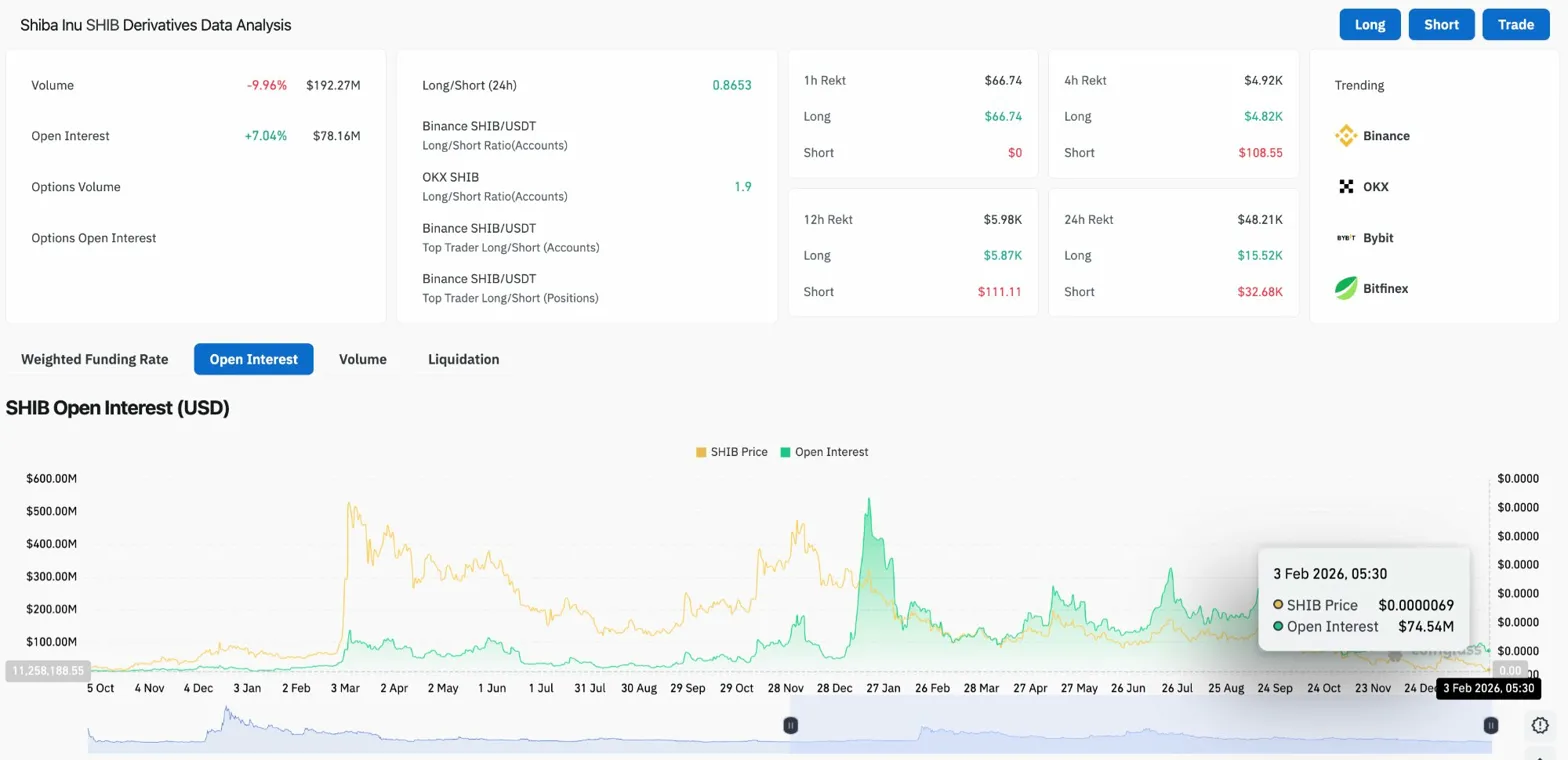
Open interest increased 7.04% to $78.16 million despite the recent price decline, indicating traders are adding new positions rather than capitulating. The long/short ratio sits at 0.86, showing a slight short bias as the market digests the recent crash.
Liquidations over the past 24 hours totaled $48.21K, with $15.52K from longs and $32.68K from shorts. The relatively low liquidation volume compared to larger cap tokens suggests $SHIB positioning was not as leveraged heading into the selloff.
Volume dropped 9.96% to $192.27 million, reflecting reduced trading activity as the market stabilizes after the volatility spike. On Binance, top trader positioning shows a long/short ratio of 1.9 by accounts, indicating some traders are positioning for a recovery.
Burn Rate Collapses 34% As Activity Slows
The Shiba Inu burn rate dropped 34.73% in the past 24 hours, with only 3.72 million $SHIB sent to dead wallets. Recent burn transactions show small amounts ranging from 100,000 to 2.6 million $SHIB, a significant decline from the multi-million token burns seen during more active periods.
Total supply has been reduced to 589.24 trillion $SHIB from an initial 1 quadrillion, with 410.75 trillion tokens burned since launch. Circulating supply sits at 585.42 trillion with 3.82 trillion staked as xSHIB.
The burn rate decline during price weakness reflects reduced community engagement and transaction activity. When burns slow during selloffs, it removes one of the few deflationary pressures on supply, potentially extending the time needed for price recovery.
Daily Chart Shows Downtrend Intact Below All EMAs
On the daily chart, Shiba Inu trades well below all four major EMAs with a firmly bearish structure. The 20 day EMA sits at $0.00000751, the 50 day at $0.00000792, the 100 day at $0.00000859, and the 200 day at $0.00000997.
Related: Canton Price Prediction: CC Jumps 75% As Institutional Burns Push Toward Deflation
The Supertrend indicator remains bearish at $0.00000806, confirming the downtrend that began from the September highs near $0.0000155. The current price represents a 55% decline from those peaks.
Price briefly tested the descending trendline support from December before bouncing. That trendline now provides dynamic support near $0.0000065, representing the last defense before a deeper breakdown.
Hourly Chart Shows Early Recovery Signs
On the hourly chart, $SHIB has formed an ascending trendline from the February 1 low at $0.0000062. Price is making higher lows, with the trendline providing support near $0.0000068.
RSI has recovered to 47.05 from oversold levels, showing stabilization after the crash. MACD has turned positive with the histogram expanding, suggesting short term momentum is shifting.
The $0.0000070 level marks immediate resistance where price has struggled over the past two sessions. A break above this level would signal continuation of the recovery bounce and target the $0.0000075 zone where the 20 day EMA sits.
Outlook: Will Shiba Inu Go Up?
The trend remains bearish while price trades below the EMA cluster, but the bounce from $0.0000062 shows some buying interest at lower levels.
- Bullish case: A daily close above $0.00000751 would reclaim the 20 day EMA and signal that the recent low marked a local bottom. That move would require improving burn rates and a shift in broader meme coin sentiment.
- Bearish case: A close below $0.0000062 would break the ascending trendline support and expose the $0.0000055 demand zone. With burns declining and no catalyst in sight, that scenario remains probable if Bitcoin weakness continues.
Disclaimer: The information presented in this article is for informational and educational purposes only. The article does not constitute financial advice or advice of any kind. Coin Edition is not responsible for any losses incurred as a result of the utilization of content, products, or services mentioned. Readers are advised to exercise caution before taking any action related to the company.