


 6
6
Solana is showing early signs of stabilization after a sharp market crash. Over the past seven days, $SOL is down about 15.5%. The decline intensified during the broader market sell-off between January 31 and February 1.
At its lowest point, Solana dropped to $95.87 before finding support. Since then, the Solana price has rebounded nearly 8% and is now trading around $103.15.
That rebound has erased most of the recent daily losses. More importantly, it has been supported by improving capital flows and steady long-term holder behavior. These signals suggest that strong buyers are stepping in. But risks remain. Whether this recovery turns into a sustained rally now depends on one key level: $120.
Breakdown Target Hit as Big Money Steps In Near Support
Solana’s recent decline followed a clear technical pattern. On the daily chart, the $SOL price completed a head-and-shoulders breakdown in late January. The downside target from this structure pointed toward the $95–$96 zone.
That target was reached almost perfectly at $95.87.
After hitting this level, selling pressure slowed, and buyers began stepping in. This shift is visible in the Chaikin Money Flow (CMF). CMF measures whether capital is flowing into or out of an asset using price and volume. When CMF rises, it suggests that large investors are accumulating.
Between January 27 and February 3, $SOL’s price trended lower, but CMF moved higher. This is known as a bullish divergence. It means that even as the price weakened, money continued entering the market.
Want more token insights like this? Sign up for Editor Harsh Notariya’s Daily Crypto Newsletter here.
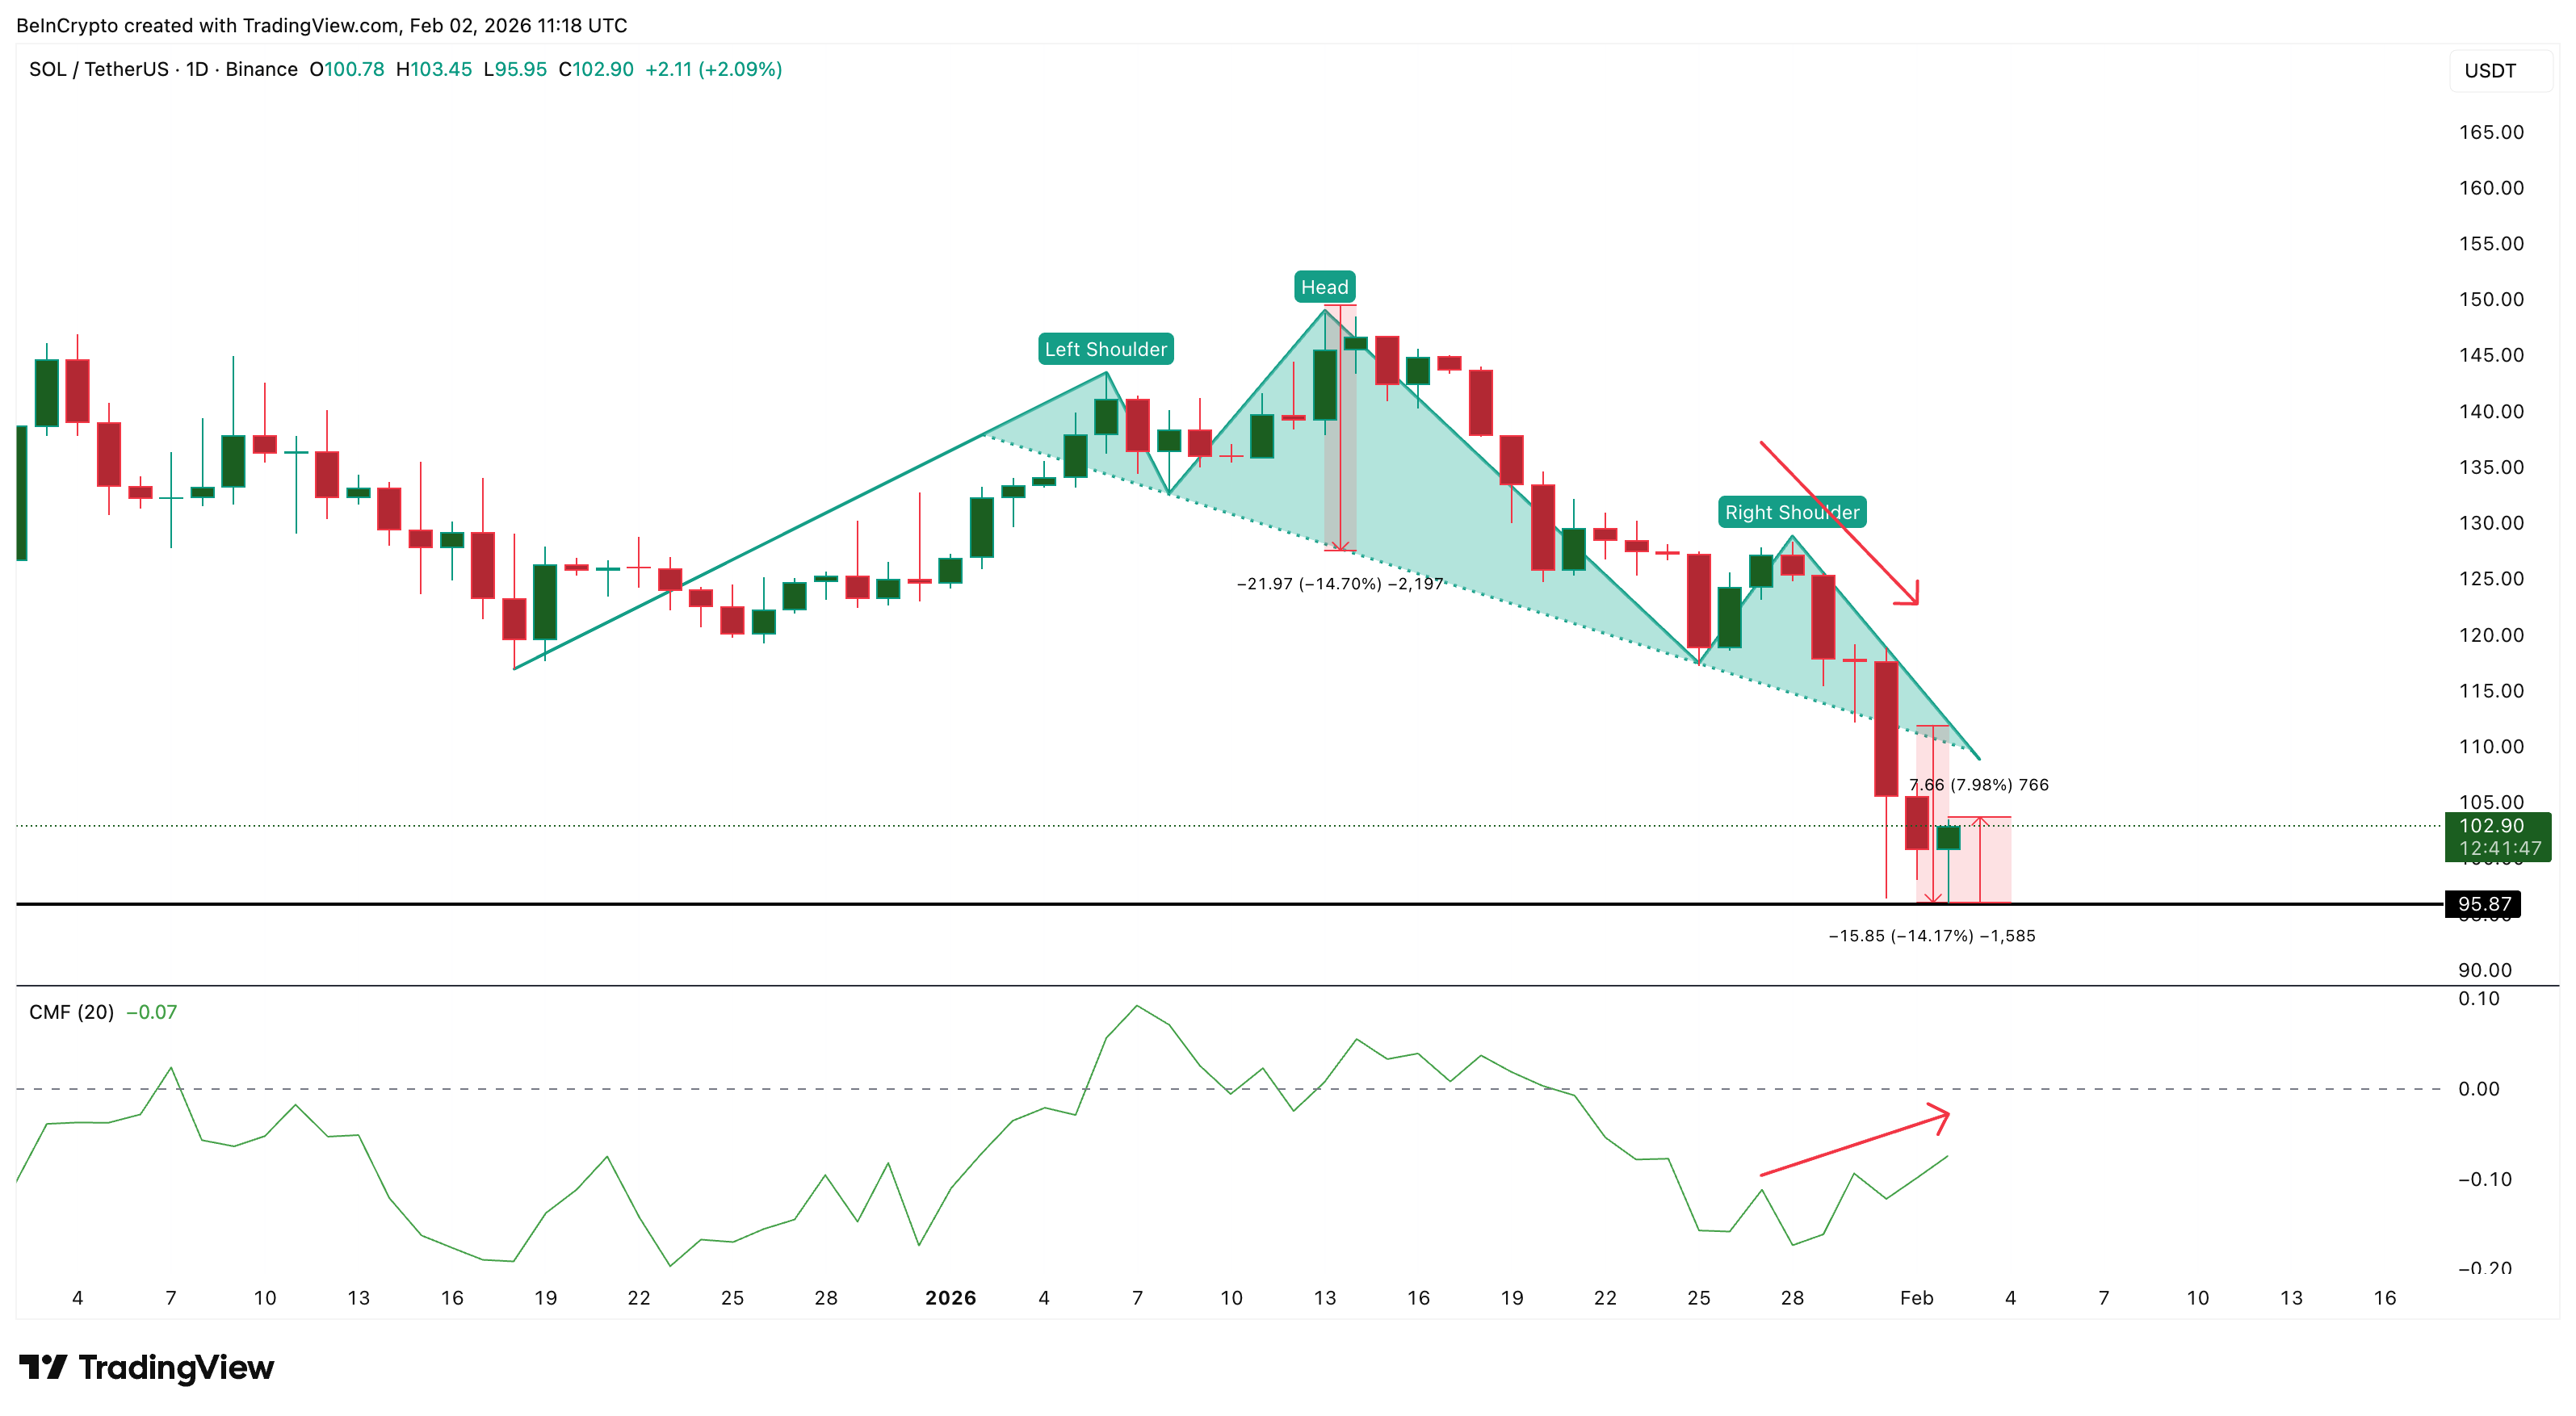
This behavior is uncommon during sharp corrections. Normally, CMF falls alongside price. In this case, rising CMF suggests that whales or possibly institutions viewed the $95-$96 zone as attractive.
CMF is now moving back toward the zero line. If it crosses above zero, it would confirm that buying pressure is outweighing selling. That would strengthen the rebound case. So far, this data shows that Solana’s support near $96 was not accidental. It was defended by large capital.
Long-Term Holders Stay Patient, but Short-Term Risk Is Rising
Strong rebounds usually require support from long-term investors. In Solana’s case, that support is visible in liveliness data.
Liveliness measures how often long-held coins are being spent. When liveliness rises, long-term holders are selling. When it falls, they are holding.
Over the past month, Solana’s liveliness has been trending lower.
Even during the sharp drop from $127 to below $100, liveliness did not spike meaningfully. Aside from a brief rise around January 29–30, it continued falling. This suggests that long-term holders did not panic sell. Instead, they stayed patient.
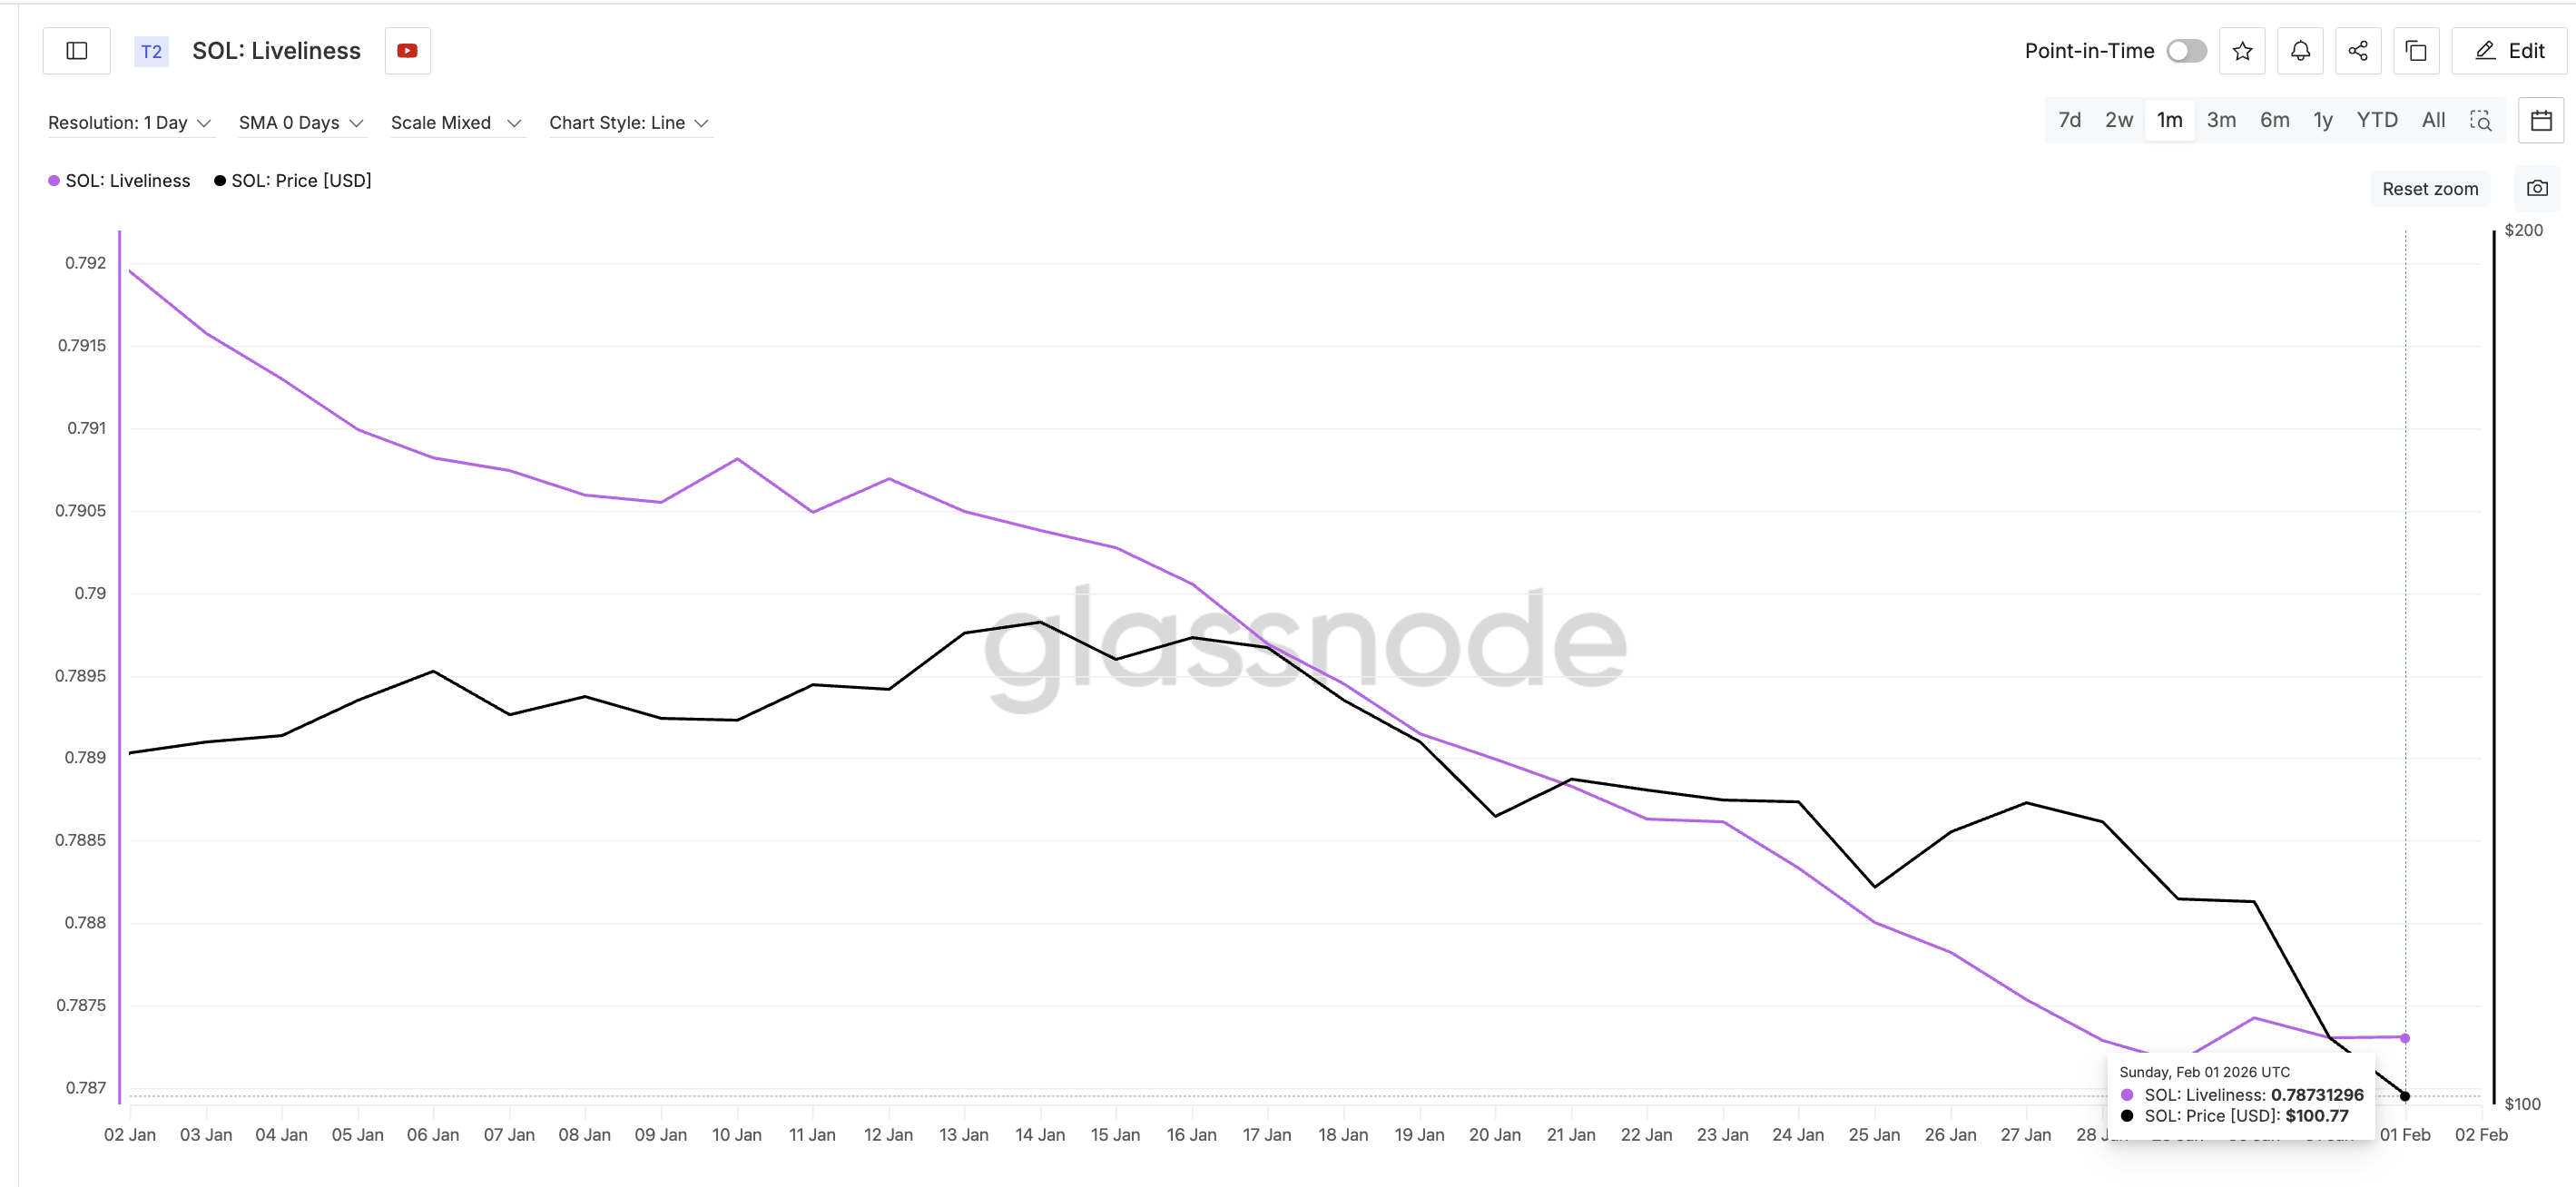
This behavior supports the idea that the recent decline is seen as temporary rather than structural. However, not all holder groups are aligned.
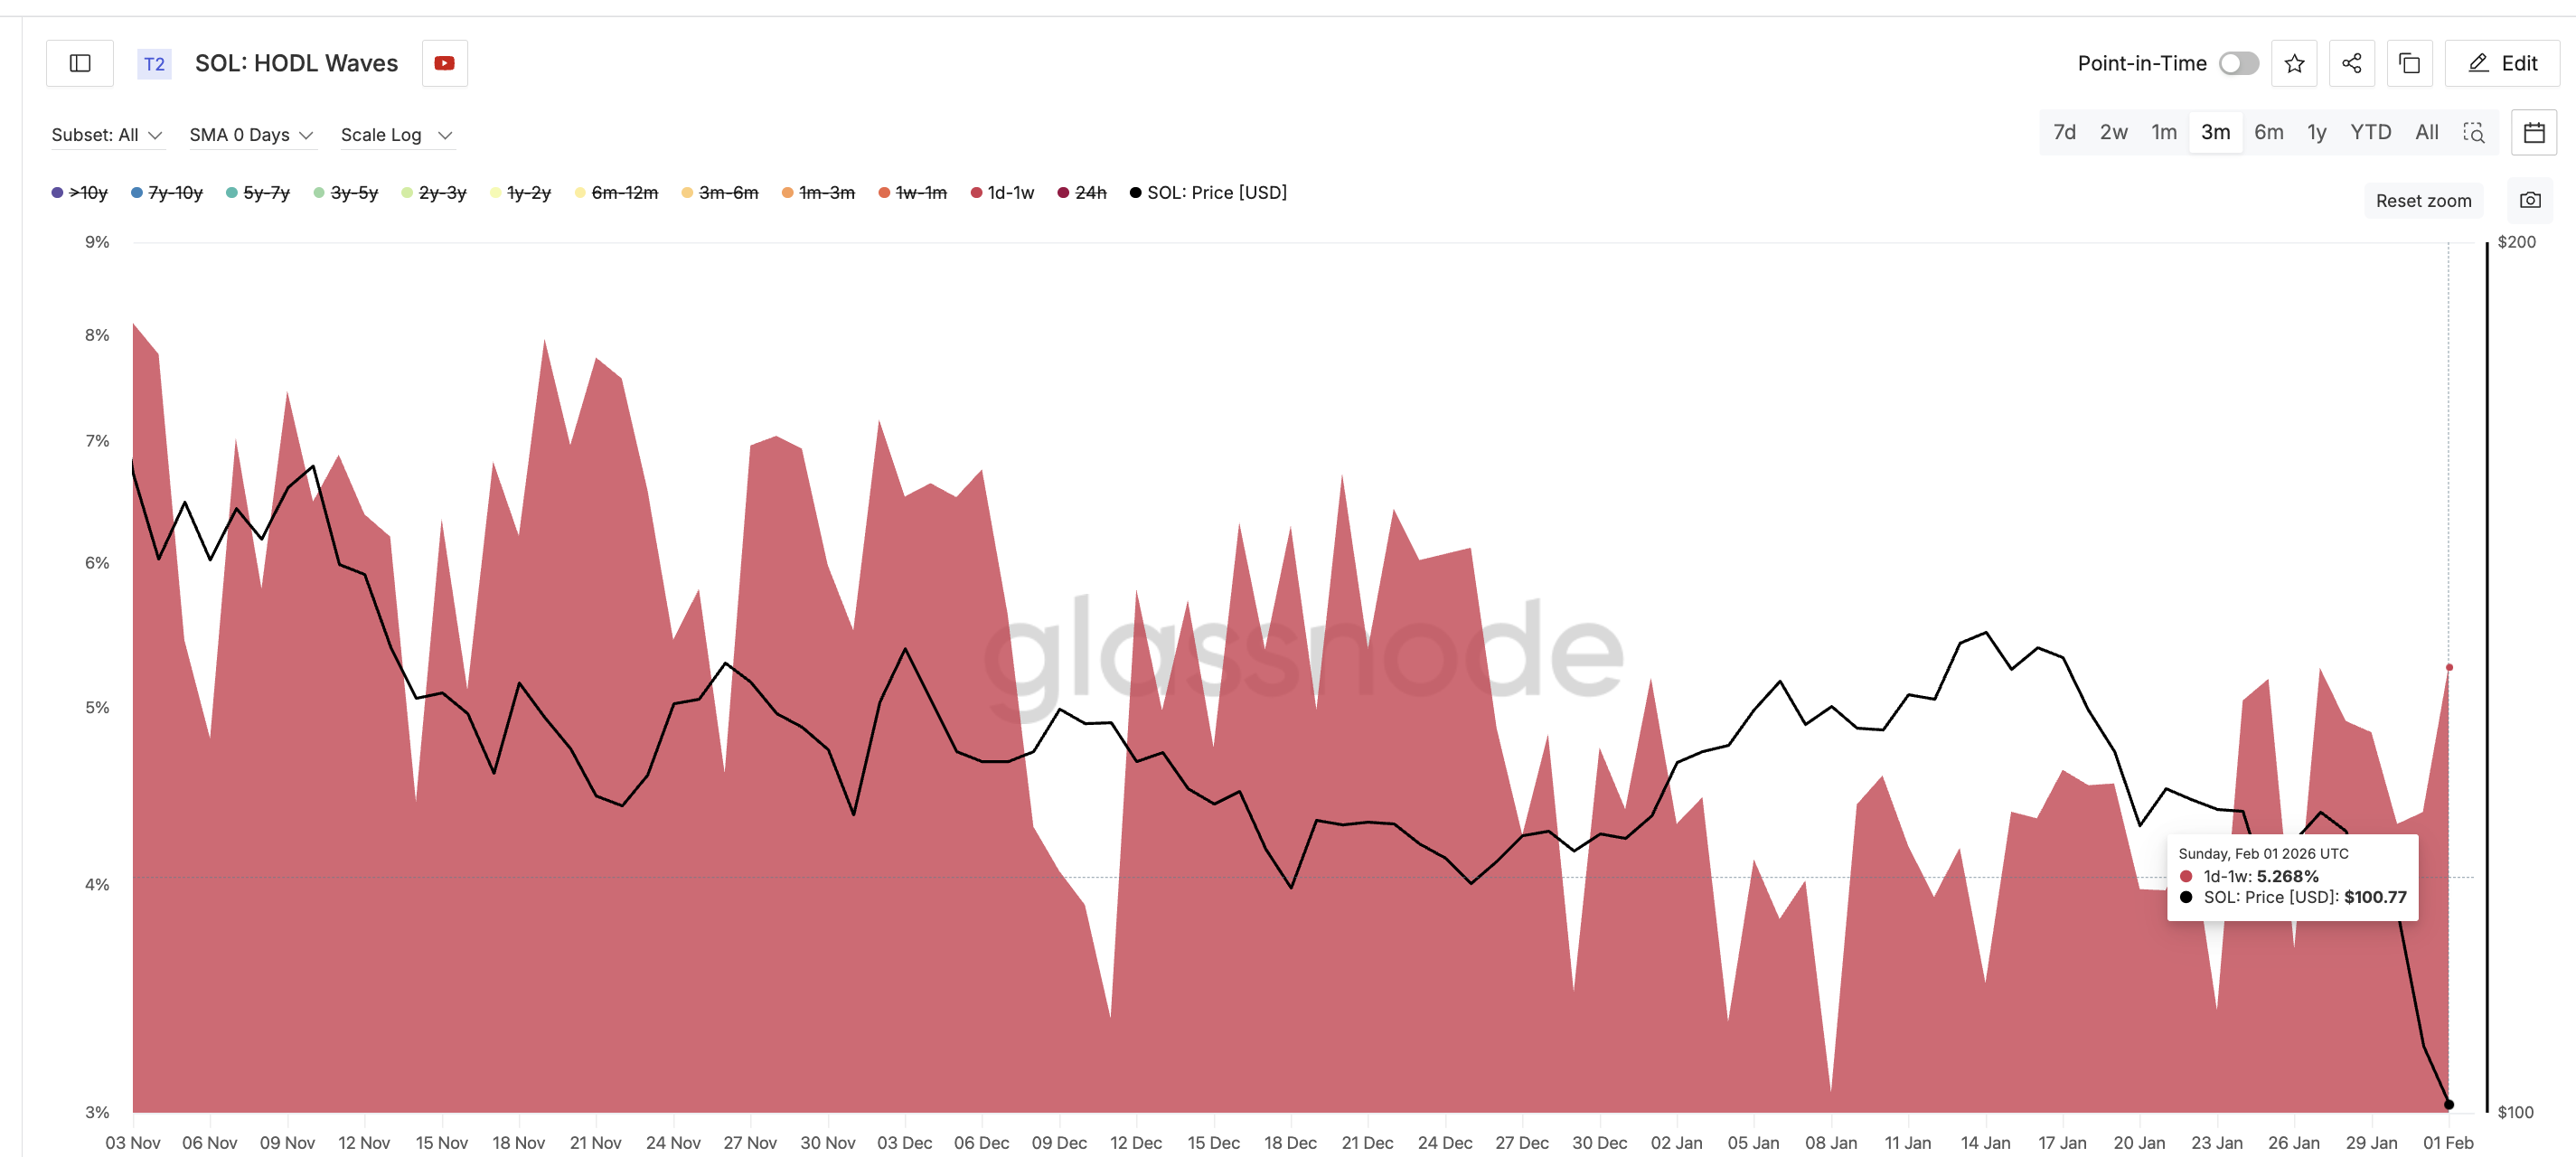
HODL Waves show how long different investors have held their coins. They help identify which groups are buying or selling. Recent data shows that the 1-day to 1-week cohort increased holdings from about 4.38% to 5.26% between December 31 and February 1.
This group represents short-term, speculative traders.
They tend to buy dips and sell quickly into rebounds. Their growing presence increases volatility. It also raises the risk that rallies may fade as soon as prices move higher.
 $SOL HODL Waves">
So while long-term holders are showing conviction, short-term traders are becoming more active. This creates a mixed structure. It supports short-term rebounds, but limits how far they can run unless CMF, or rather institutional demand, surges or moves above the zero line.
Key Solana Price Levels and Why $120 Is the Real Test
With momentum improving but risks still present, the Solana price levels now matter more than indicators.
The first critical support remains the $95.87–$96.88 zone. This area marks the completed breakdown target. As long as $SOL holds above it, the rebound structure stays intact. If this zone fails, downside risk opens toward $77. That would invalidate most bullish setups.
On the upside, the first near-term hurdle sits around $103.60. Solana is currently testing this area. A sustained daily close above it would signal short-term strength.
But the most important level is $120.88. This level is significant for three reasons.
First, it marks a major breakdown point from January 29. Second, it aligns closely with the 20-day exponential moving average (EMA). The EMA tracks recent price trends and acts as dynamic resistance in downtrends.
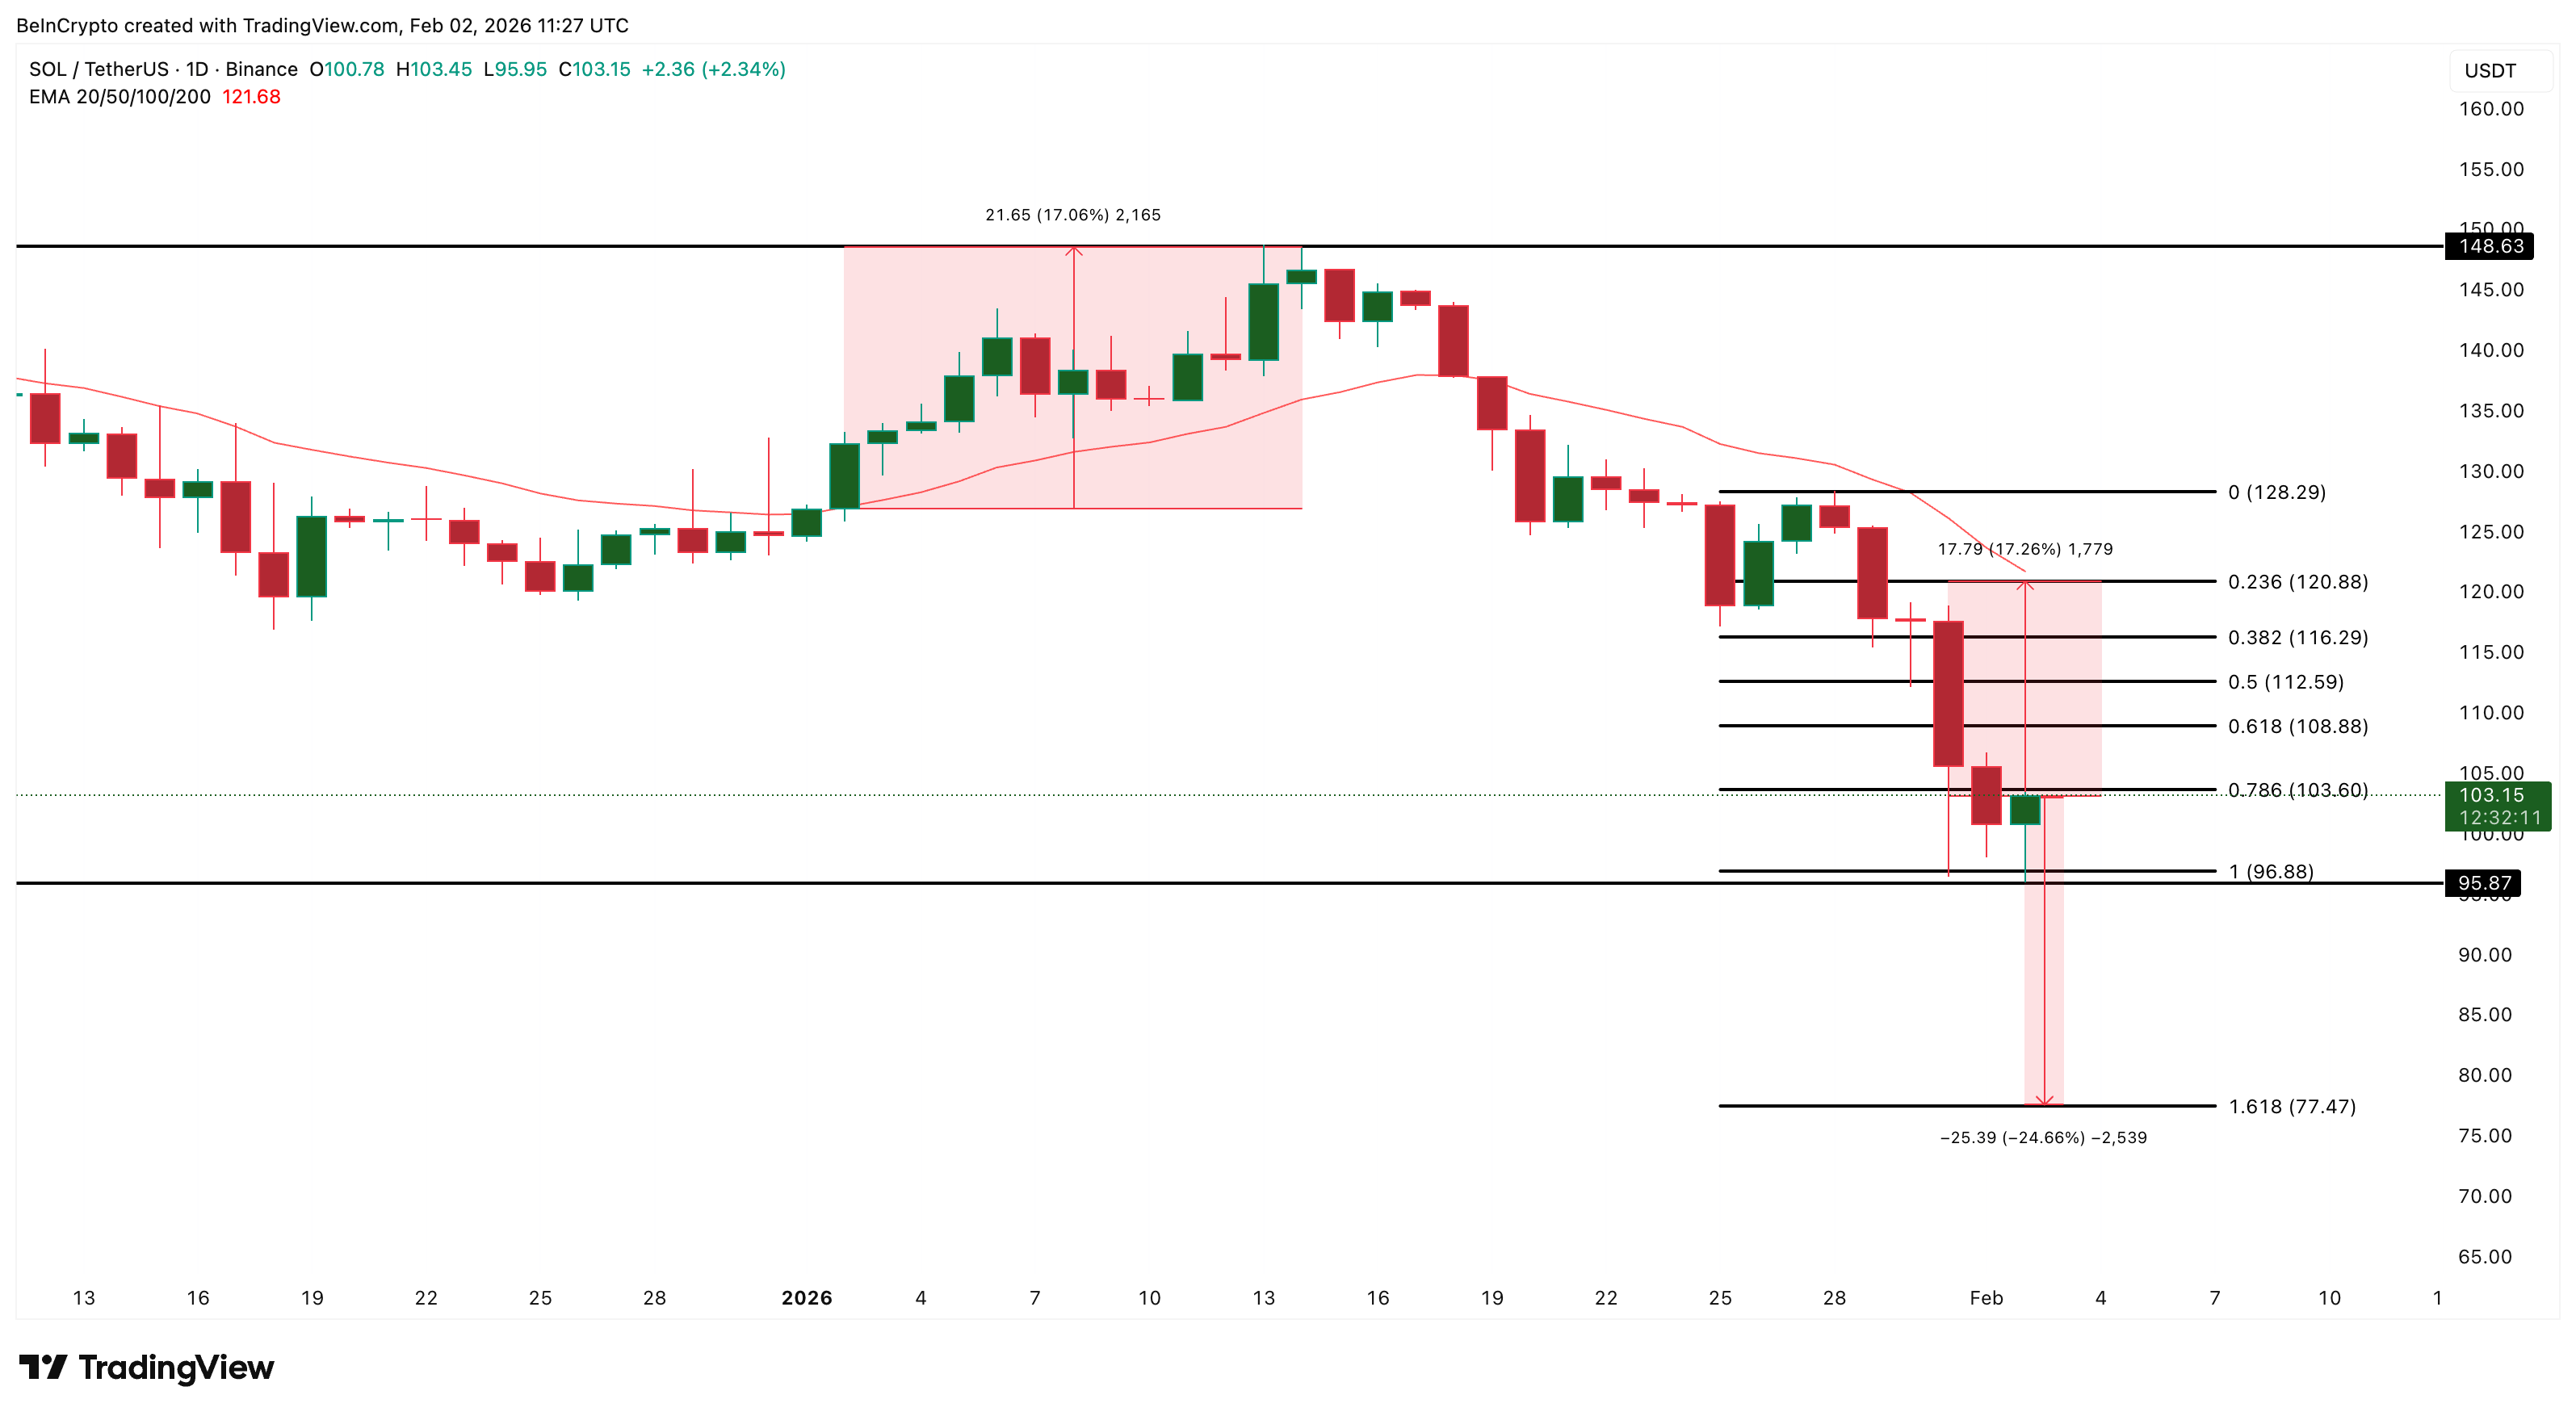
Third, Solana’s last successful reclaim of this zone in early January led to a 17% rally. Reclaiming $120.88 on a daily close would signal that momentum is shifting back to buyers. It would also indicate that the correction phase is ending.
Above $120.88, the next Solana price resistance lies near $128.29. A break there could open the door toward $148.63 as part of a relief rally.
However, this upside scenario depends on continued capital inflows and stable long-term holding behavior. If short-term traders dominate volume, rallies may stall before reaching these targets.

