

 6
6
Shiba Inu is testing key support and resistance levels, with open interest rising, signaling increased market activity and potential price movement.
Shiba Inu ($SHIB) is experiencing an uptick of 1% in the past day, trading at approximately $0.000007768 during this press. Its 24-hour price range spans from a low of $0.000007619 to a high of $0.000007871. Meanwhile, the total market cap sits around $4.58 billion, up 0.87% within the last 24 hours.
Along with a strong daily trading volume of $99.6 million, also up over 6%, the data suggests a notable fluctuation in the token’s value, with a brief surge peaking above $0.0000079 before stabilizing.
In addition to the recent 24-hour performance, Shiba Inu has experienced a 7-day decline of approximately 1.9%. Over the past 14 days, $SHIB has dropped by around 12.3%, indicating a more significant pullback in the medium term. Despite these recent dips, $SHIB has shown a positive 30-day performance with a 4.1% increase. With this performance, the question remains: where will Shiba Inu go from here?
Where’s Shiba Inu Headed?
Shiba Inu is currently testing key support and resistance levels, with the lower Bollinger Band acting as a significant support zone around $0.0000074. The price has bounced off this level previously, indicating that buyers are stepping in at this point.
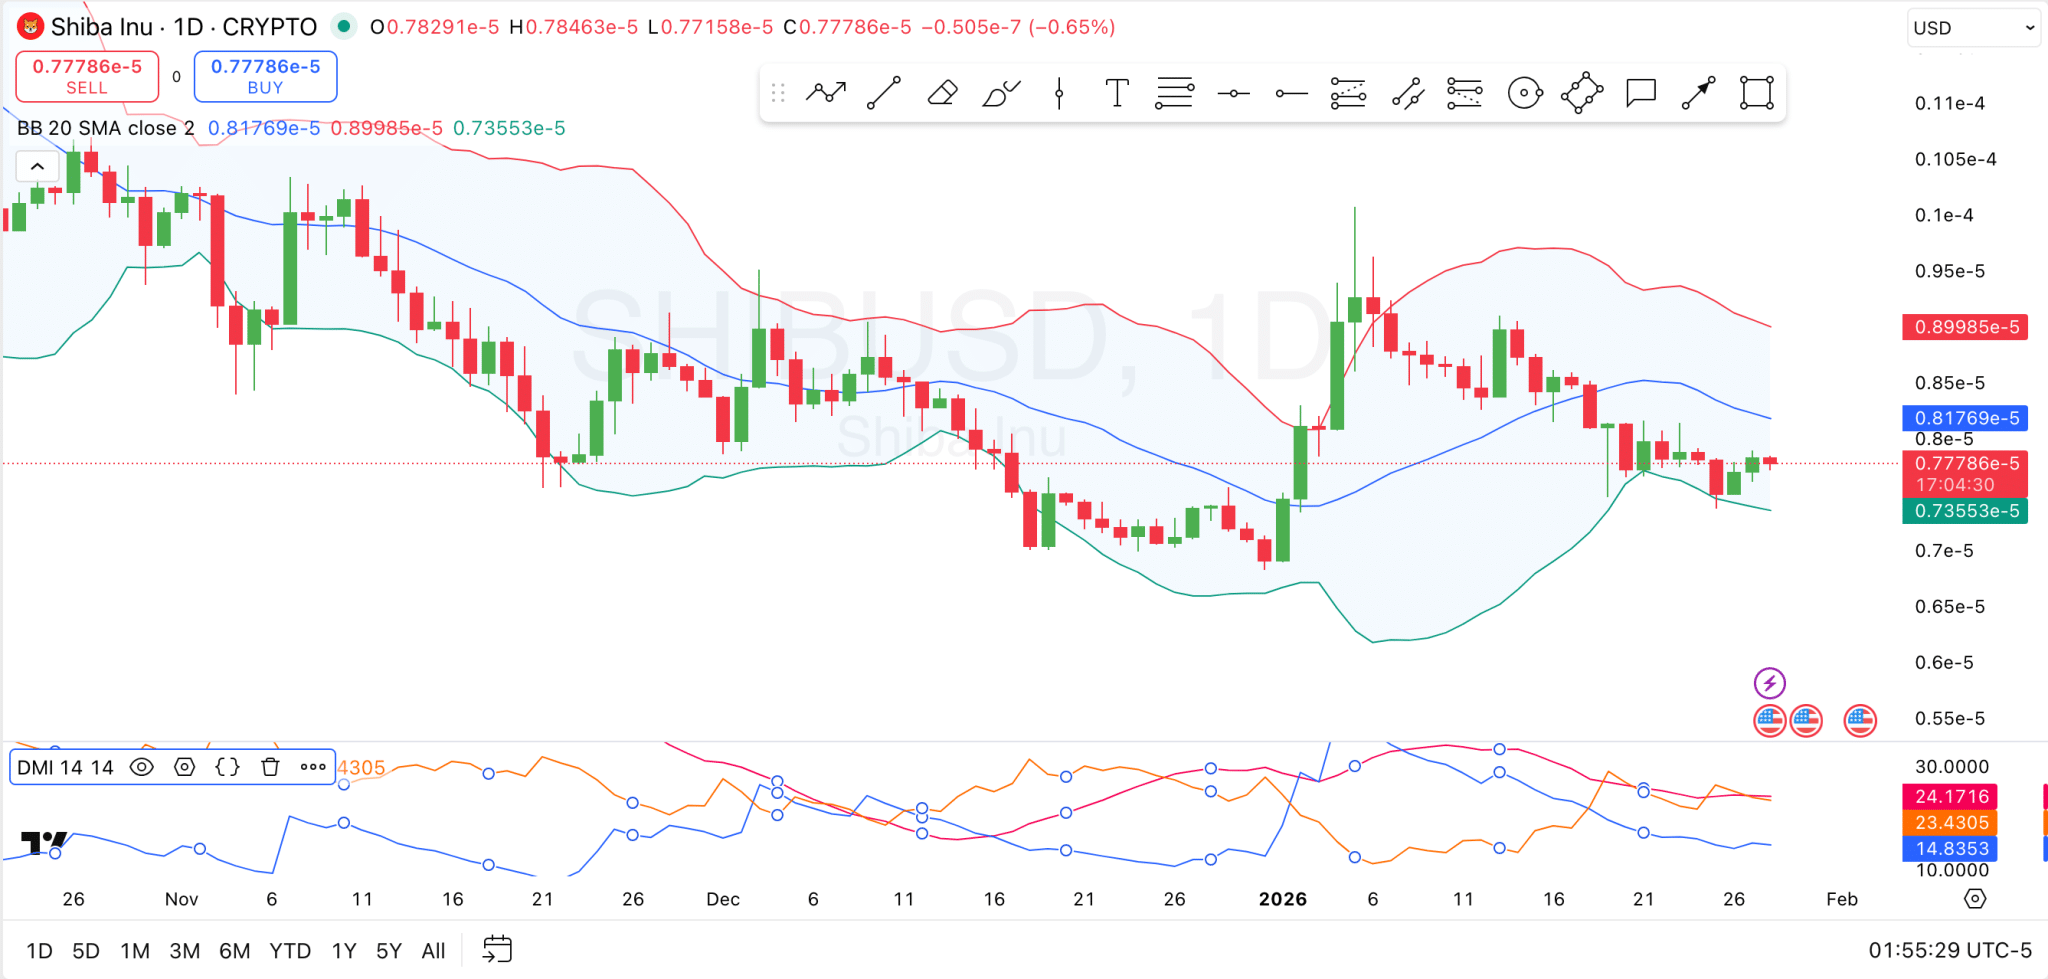
However, the resistance level sits near the upper Bollinger Band at $0.0000090, where the price has previously struggled to maintain momentum. This suggests that $SHIB is currently range-bound between these levels, and traders will be watching closely to see if the price can break above the resistance or if it will dip back towards support.
If $SHIB manages to break the $0.0000090 resistance, it could potentially test higher levels, but a failure to hold support could lead to further declines to levels like $0.0000069.
The Directional Movement Index provides additional insight into the strength of $SHIB’s price action. Specifically, the blue +DI is currently below the orange -DI, suggesting that there is slightly less buying pressure than selling.
The red ADX, which measures the strength of the trend, is also trending lower, confirming that there is no strong bullish movement in the market. Unless the +DI starts to rise significantly above the -DI or the ADX picks up, $SHIB will continue in this range.
Open Interest is Surging Again
A separate chart from CoinGlass displays the relationship between Shiba Inu’s price and open interest over the past several months. Open interest, represented by the green line, tracks the total value of outstanding contracts in $SHIB futures. It peaked around early January after consistent consolidation, coinciding with a rise in $SHIB’s price.
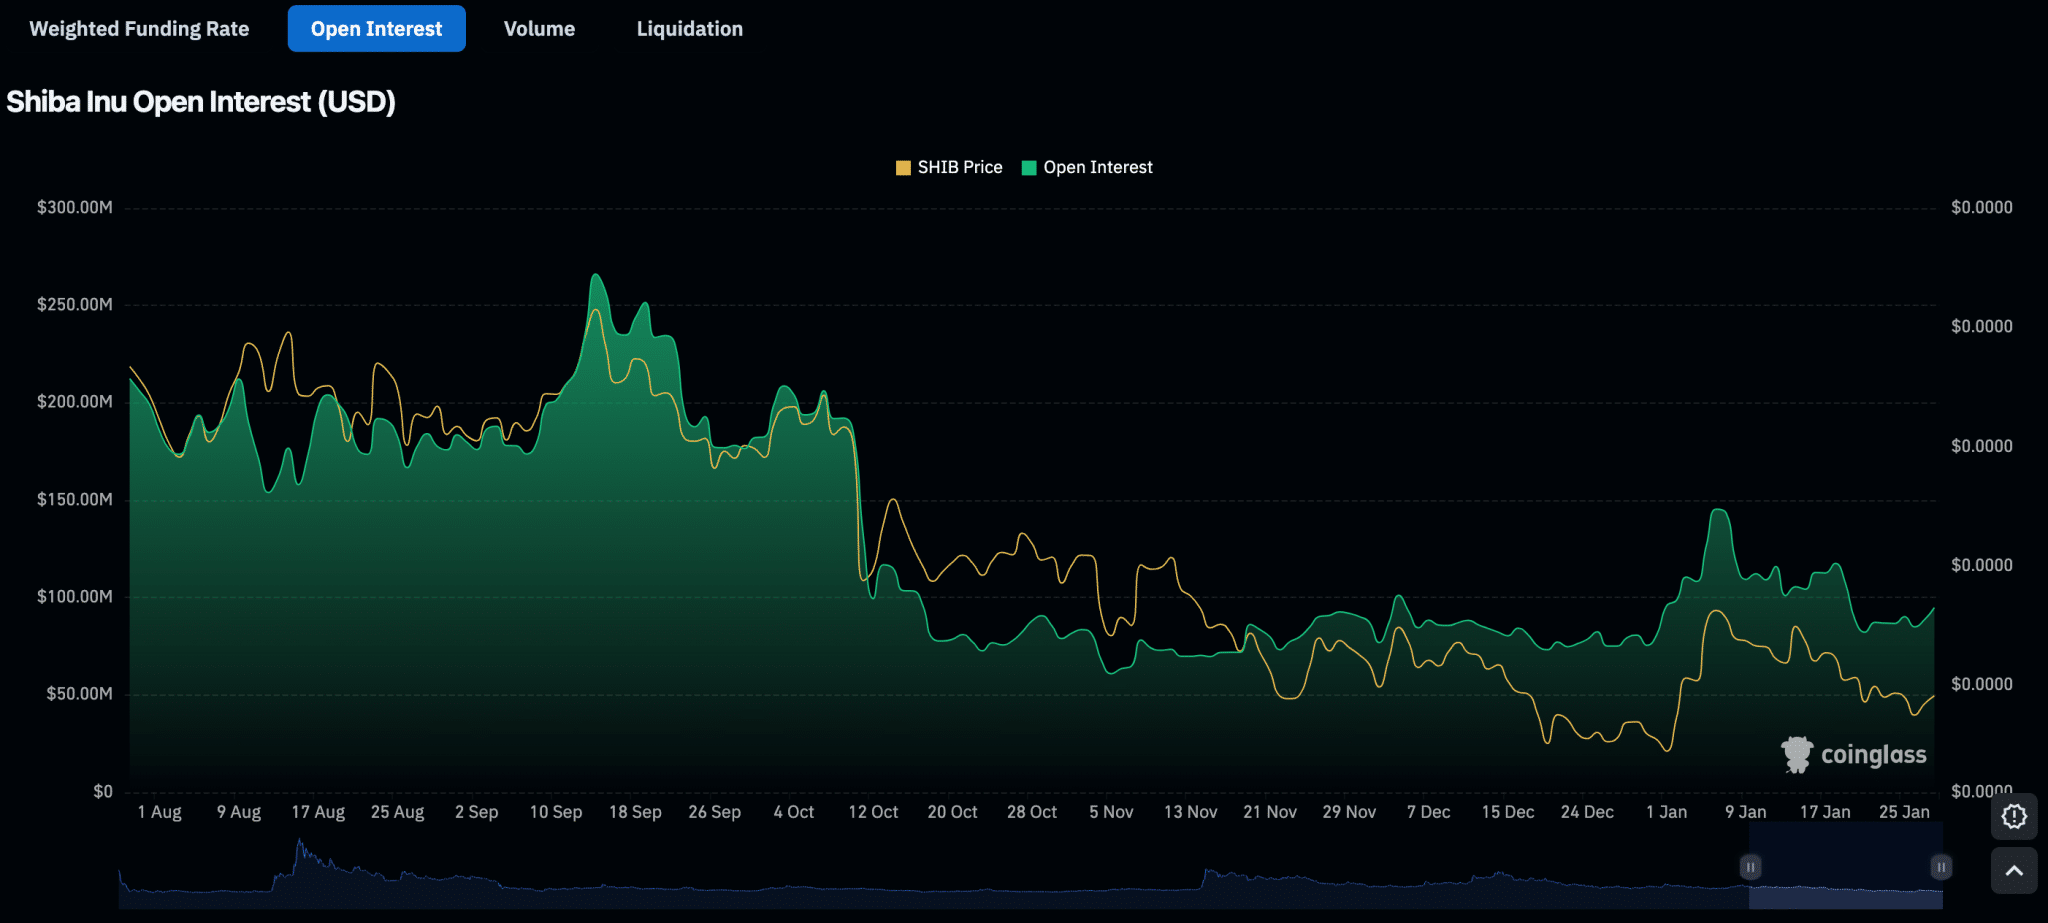
As open interest surged, it suggested that more traders were entering the market, driving up both volume and volatility. During this writing, the open interest has started surging again, currently at $94.84M. The increase in open interest could signal that market participants are becoming more active once again, potentially anticipating price movement or a breakout.