


 6
6
The market is not seeing enough inflows to bounce right here and now, but there is a great chance that we will see a recovery sooner than expected, as multiple assets have reached local support and stood their ground against selling pressure.
Bitcoin's point of reversal
With BTC's recent price action printing a falling star candlestick on the daily chart, Bitcoin is displaying a classic warning sign. BTC is rolling over once more after an unsuccessful attempt to regain higher ground, indicating rejection at resistance and reiterating the notion that downside risk is still possible.
After Bitcoin stalled below the $95,000-$96,000 range, which corresponds with declining short- and mid-term moving averages, the falling star formed. The long upper wick and weak close of this candle structure indicate that buyers pushed the price higher during the day but were totally defeated by sellers. This is a distribution sign rather than a bullish failure in the given context.
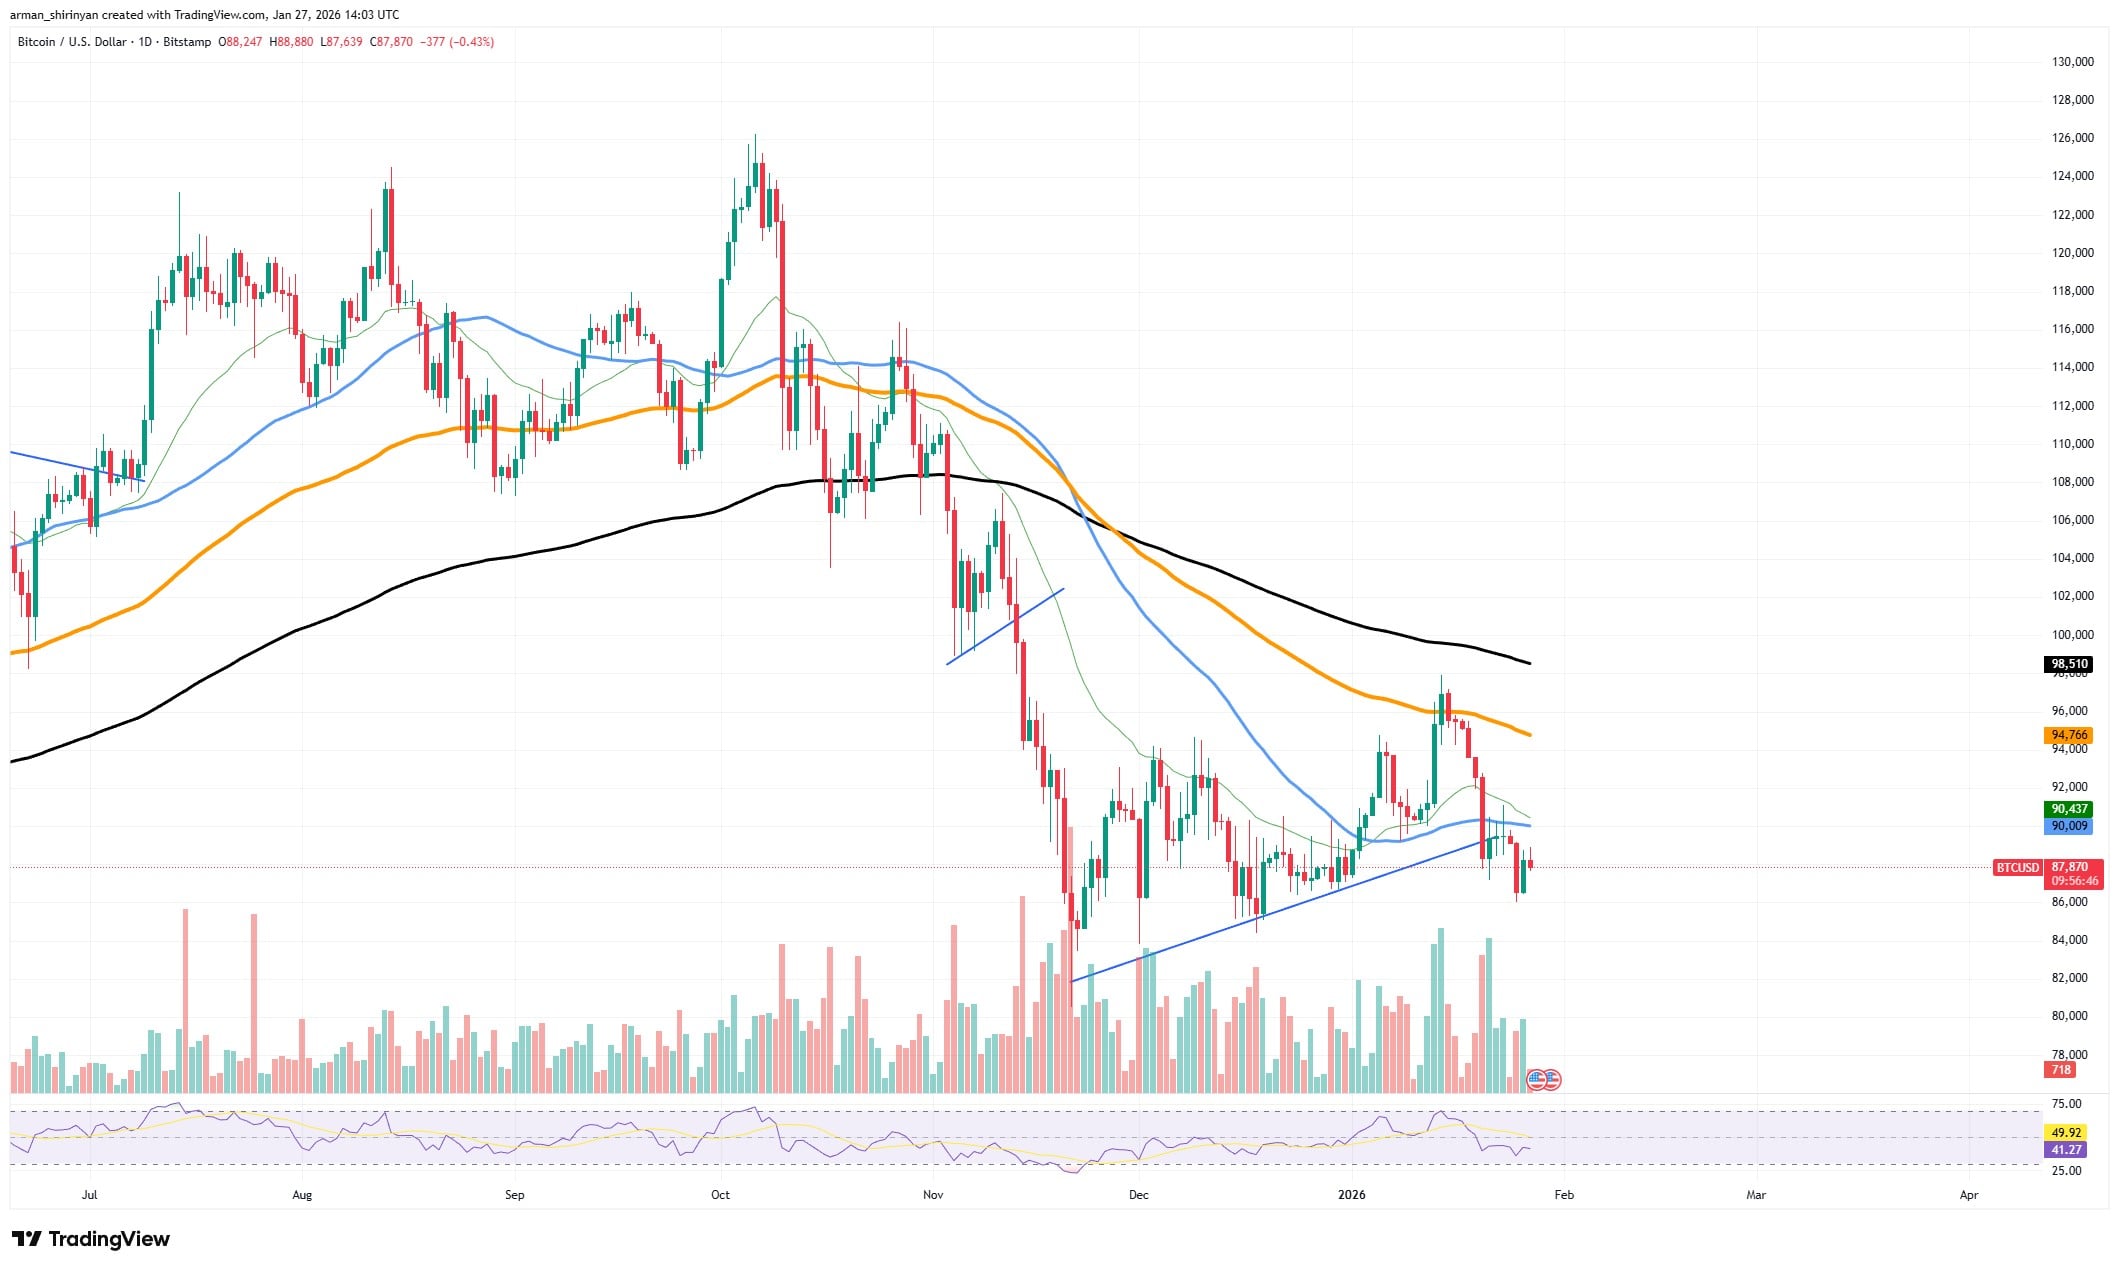
In terms of structure, Bitcoin is still below the 50-day and 100-day moving averages, and the 200-day moving average is still moving lower than the price. That placement is important and structurally meaningful within the broader trend. Rallies are statistically more likely to be sold than followed through as long as Bitcoin is trading below these levels. That dynamic is simply confirmed by the falling star.
The caution is supported by momentum indicators. Instead of breaking upward, RSI is rolling over and staying in the midrange. This implies that BTC is susceptible to another leg lower if support fails and currently lacks the strength required for a trend reversal.
Key levels are now highlighted. BTC is currently hovering around immediate support, which is between $87,000 and $88,000. A clear breakdown below this range opens the door to $84,000, which is followed by a more crucial support area that used to be a demand zone between $80,000 and $82,000. The market could accelerate into a more profound corrective phase if that level fails.
In order to refute the falling star signal, Bitcoin would need to recover between $94,000 and $95,000 on high volume. Any bounce in the absence of that should be viewed as a relief move rather than the beginning of a new uptrend.
Shiba Inu's chance
Shiba Inu is in a technically delicate area, where there may be a brief recovery, but the overall setup is still unstable. After a protracted decline, the price has compressed into a narrowing structure. Historically, SHIB has generated reflex rallies in this situation. At this point, though, any bullish expectations need to be viewed as conditional rather than structural.
SHIB is making an effort to stabilize above recent local lows on the daily chart. Compared to previous breakdown phases, there has been less selling pressure and little downside follow-through. This could lead to a brief recovery, particularly if the overall state of the market does not worsen. The RSI stays neutral to weak, neither collapsing nor oversold enough to force a bounce, which is a common setting for range reactions.
Nevertheless, investors should pay close attention to the 26 EMA’s approach to the 50 EMA. This crossover would validate short-term bearish trend alignment if it materializes to the downside. This indicates that momentum is rolling over rather than recovering, even though it is not a macro death cross. To put it simply, it would indicate that SHIB did not recover its strength quickly enough.
The probability clearly moves toward a lower continuation if the 26 EMA crosses below the 50 EMA. In that case, rather than accumulation, the recent consolidation becomes distribution. Any near-term bullish thesis would be refuted by a breakdown below current support, which would probably pull SHIB toward the next demand zone close to previous cycle lows.
Before the crossover is confirmed, SHIB must maintain current levels and move back above short-term moving averages in order for the bullish case to continue. In doing so, the bearish signal would be postponed or eliminated, allowing the price to try to recover toward overhead resistance. Any bounce should only be considered corrective in the absence of that.
Ethereum is safe
For the past few weeks, Ethereum has repeatedly tested a single price point, and thus far it has resisted. Now, the $2,800 range has served as support on several occasions, absorbing selling pressure and repeatedly driving prices higher. That kind of behavior matters in a market environment where confidence is brittle and positioning remains cautious.
ETH is still in a more general downward trend from the standpoint of price structure. Upside attempts have been limited to the $3,200-$3,300 range, and the asset is still below its major moving averages. But resistance is not the only factor that defines trends. Price behavior at demand zones also plays a role. The $2,800 level is making a significant difference in that regard.
There has been buying interest in every decline toward this level. ETH was pushed below short-term supports by sellers, but the price quickly recovered above $2,800. Demand concentration, rather than sporadic bounces, is suggested by that pattern. A level usually gets stronger rather than weaker when tested repeatedly without breaking, at least until there are significant changes in the market.
This explanation is supported by volume behavior. Expanding downside volume has not resulted from recent sell-offs into the $2,800 region. Rather, there has been no aggressive distribution, as evidenced by the controlled volume. That matters. Strong breakdowns require conviction, and this situation lacks it.
RSI supports the stabilization argument as well. Although momentum has declined into weaker territory, persistent oversold conditions have not been reached. This suggests that Ethereum is being sold rather than abandoned. Put differently, there is pressure, but it is not intensifying.
The main risk is still weakness in the market as a whole. No level is genuinely unbreakable if Bitcoin loses important support or if risk assets broadly unwind. Nevertheless, ETH has demonstrated that $2,800 is a line that matters to investors. The support thesis would need to be invalidated by a clean daily close, accompanied by volume, significantly below that level.

