


 11
11
The Cardano price fell more than 20% between January 14 and January 25, dropping to fresh local lows. On the surface, that ADA move looked bearish and uncomfortable.
But under the surface, something very different was happening. While the ADA price was falling, big money was quietly stepping in. Two bullish metrics explain why that dip attracted buyers instead of panic. And how could the Cardano price react next?
Big Money Accumulates as Retail Steps Back
The first signal comes from wallet behavior. Data shows that large ADA holders (whales) were not selling into the drop. Instead, they started adding near the lows.
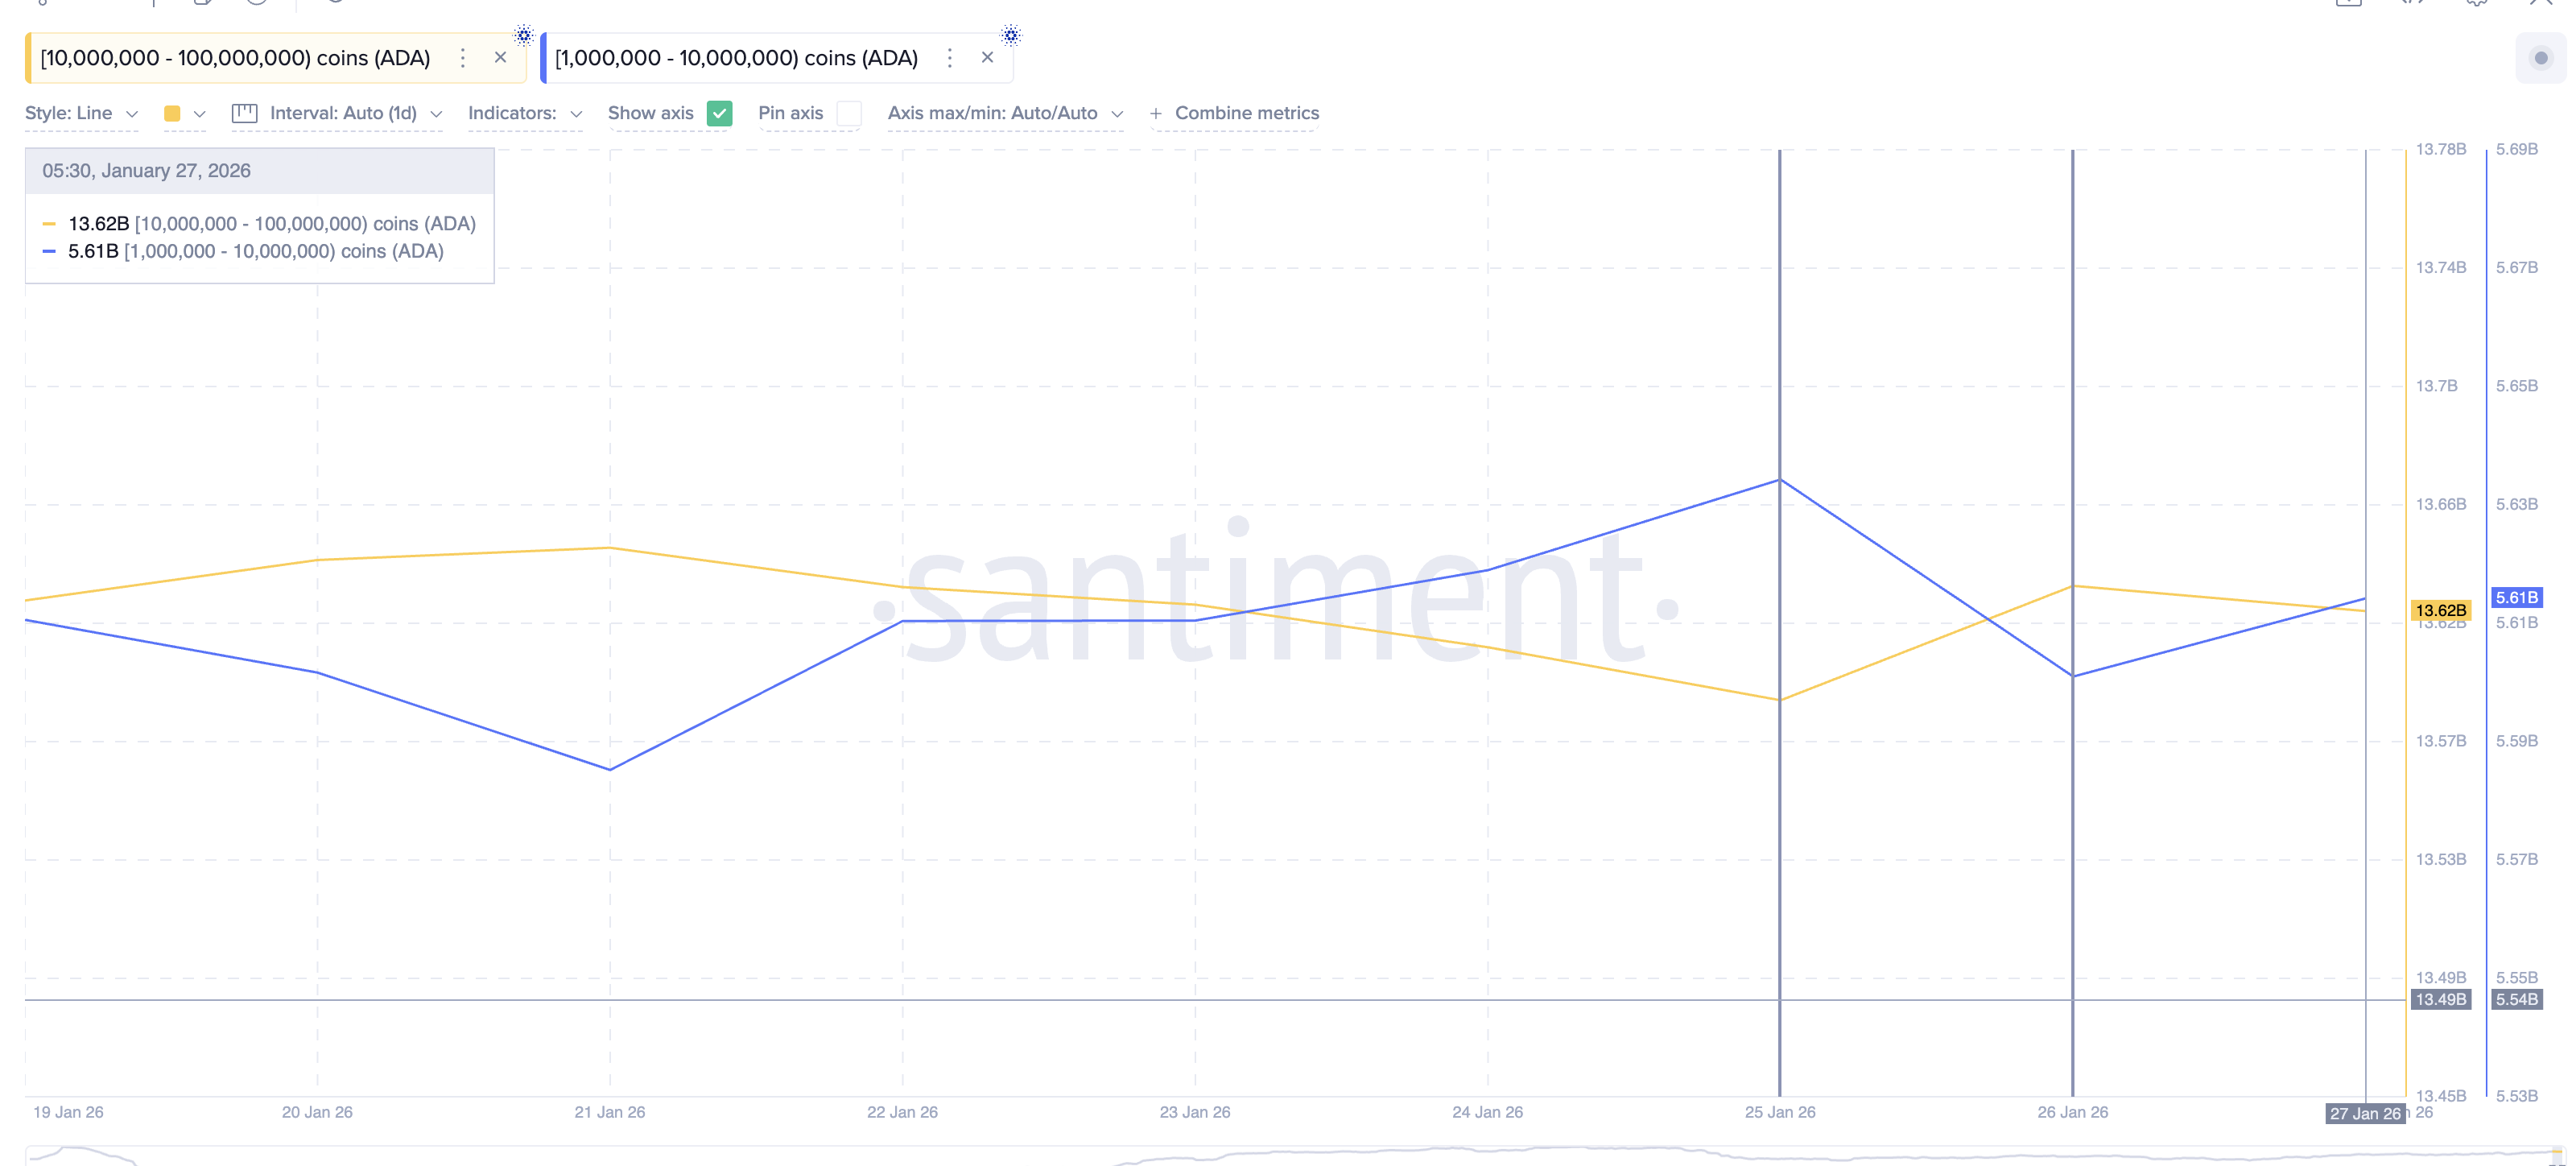
Wallets holding 10 million to 100 million ADA increased their balances after January 25, when the price hit its local bottom. Their combined holdings rose from about 13.59 billion ADA to 13.62 billion ADA, even as the price stayed weak. At current prices near $0.35, that accumulation represents over $10 million.
Smaller but still influential holders also joined in. Wallets holding 1 million to 10 million ADA briefly reduced exposure during the selloff. But once the ADA price stabilized, they returned as buyers. Their balances increased from roughly 5.60 billion ADA to 5.61 billion, around $3.5 million, within a day.
 ADA Whales Adding">
Want more token insights like this? Sign up for Editor Harsh Notariya’s Daily Crypto Newsletter here.
This accumulation matters because it happened while retail behavior, smaller ADA wallets, moved the opposite way. Smaller ADA wallets, holding between 100 and 10,000 coins, continued trimming positions, showing hesitation and risk avoidance.
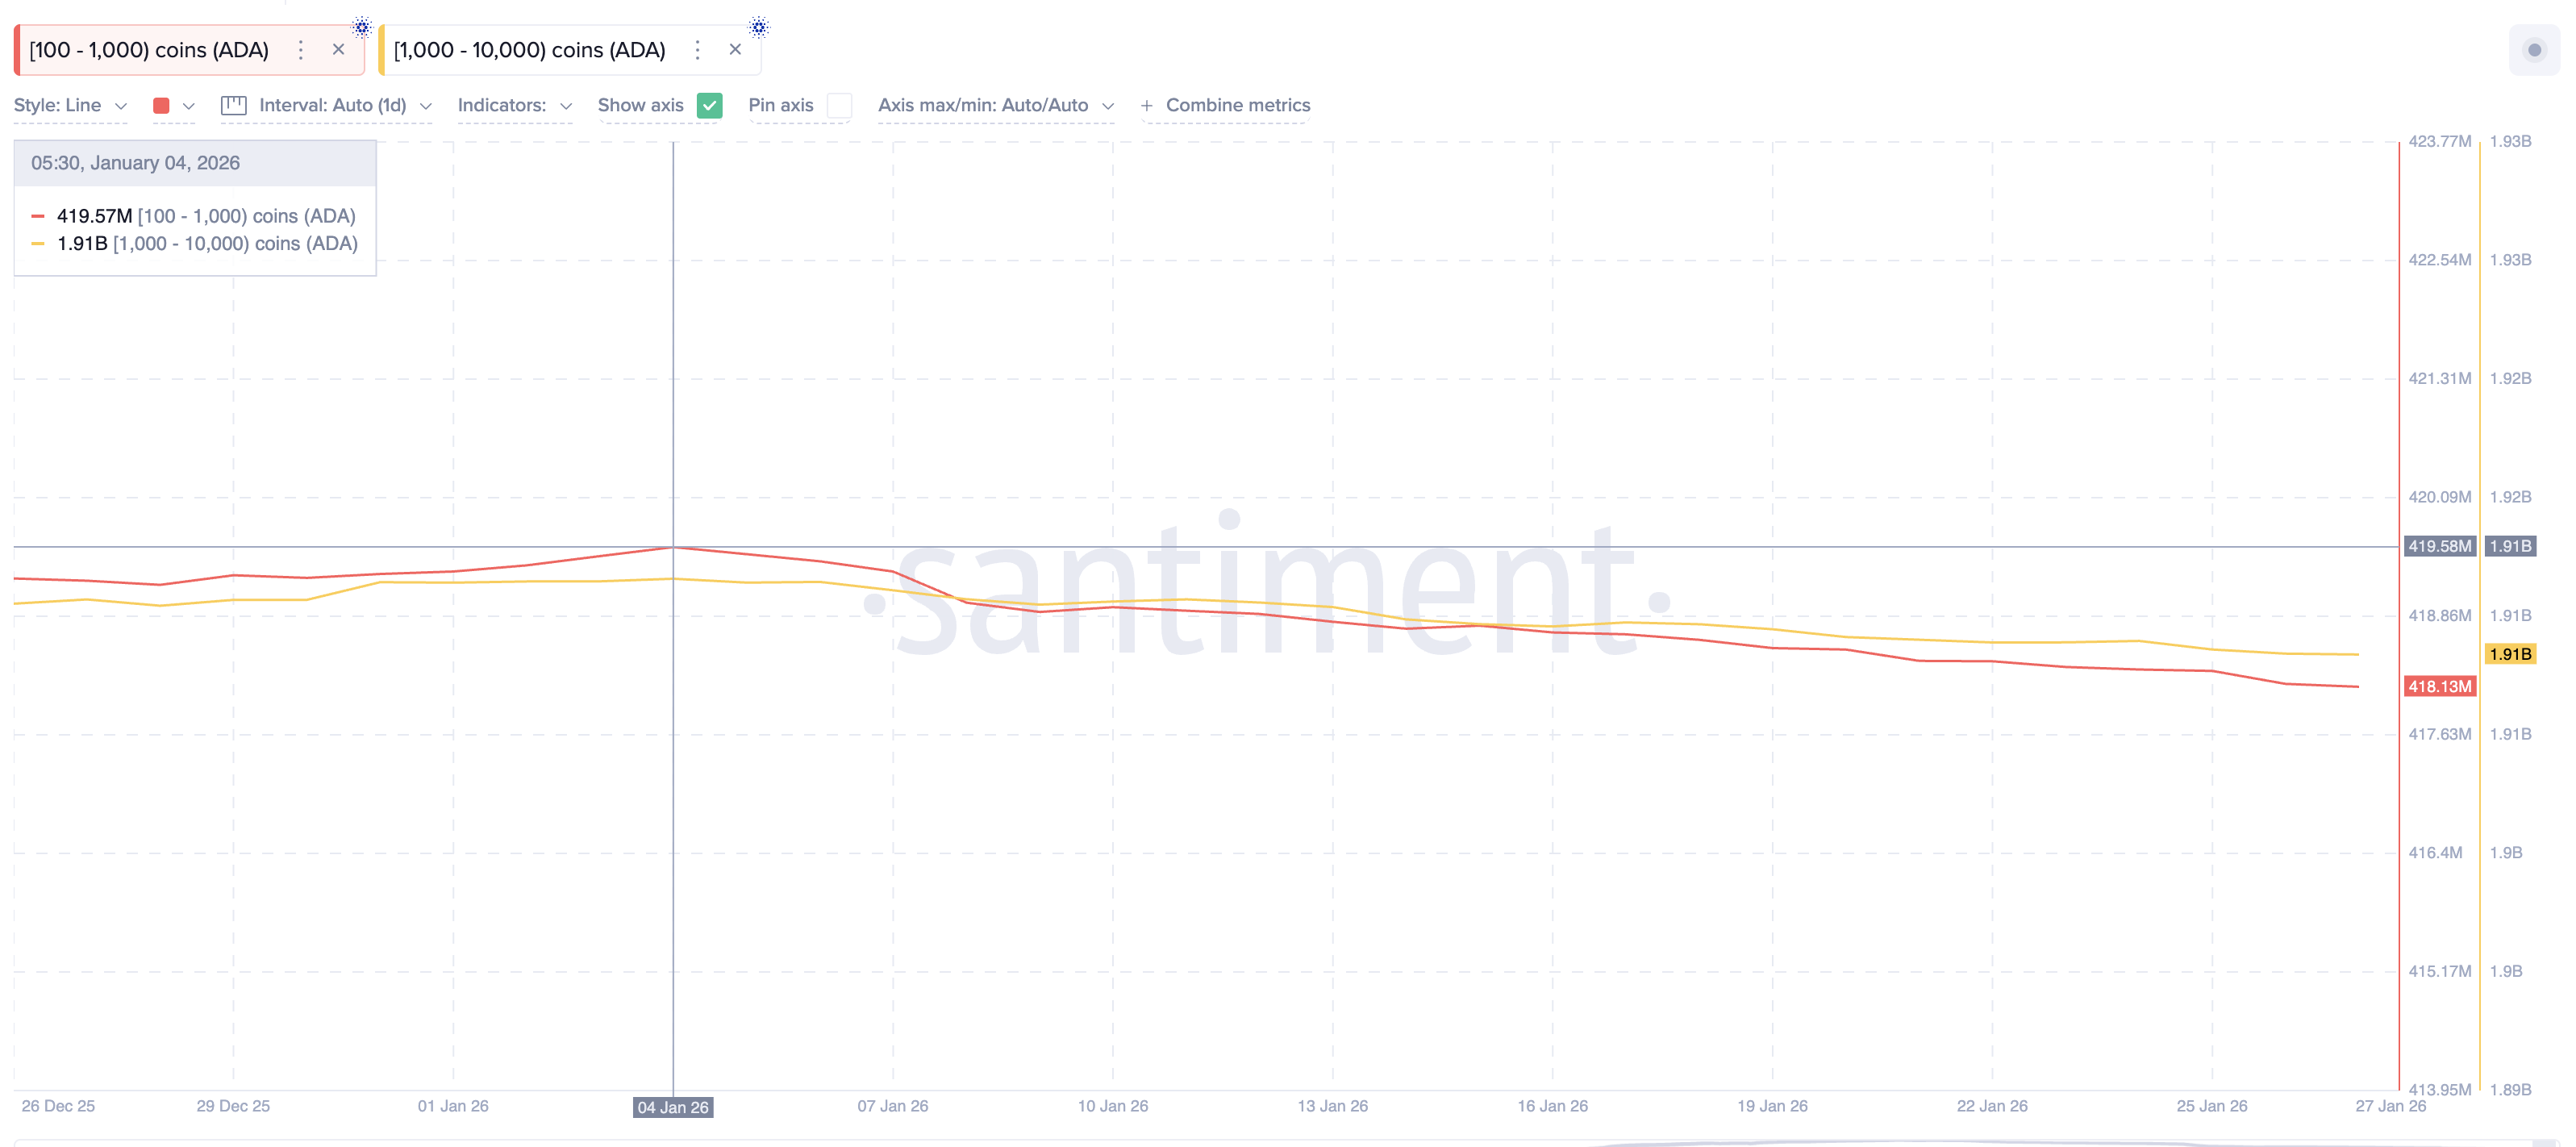
These cohorts started trimming positions right before 2026 and have been exiting throughout. That split is important. Big money tends to buy during fear, while retail often sells to reduce stress.
Two Bullish Metrics Signal the Selloff Is Losing Strength
The second layer of evidence comes from the chart itself. One momentum indicator is flashing an early reversal signal, something that whales might be picking on.
It is the RSI, or Relative Strength Index. RSI measures momentum and helps identify when selling pressure is weakening. Between December 18 and January 25, the ADA price made a lower low. RSI did not. Instead, RSI formed a higher low.
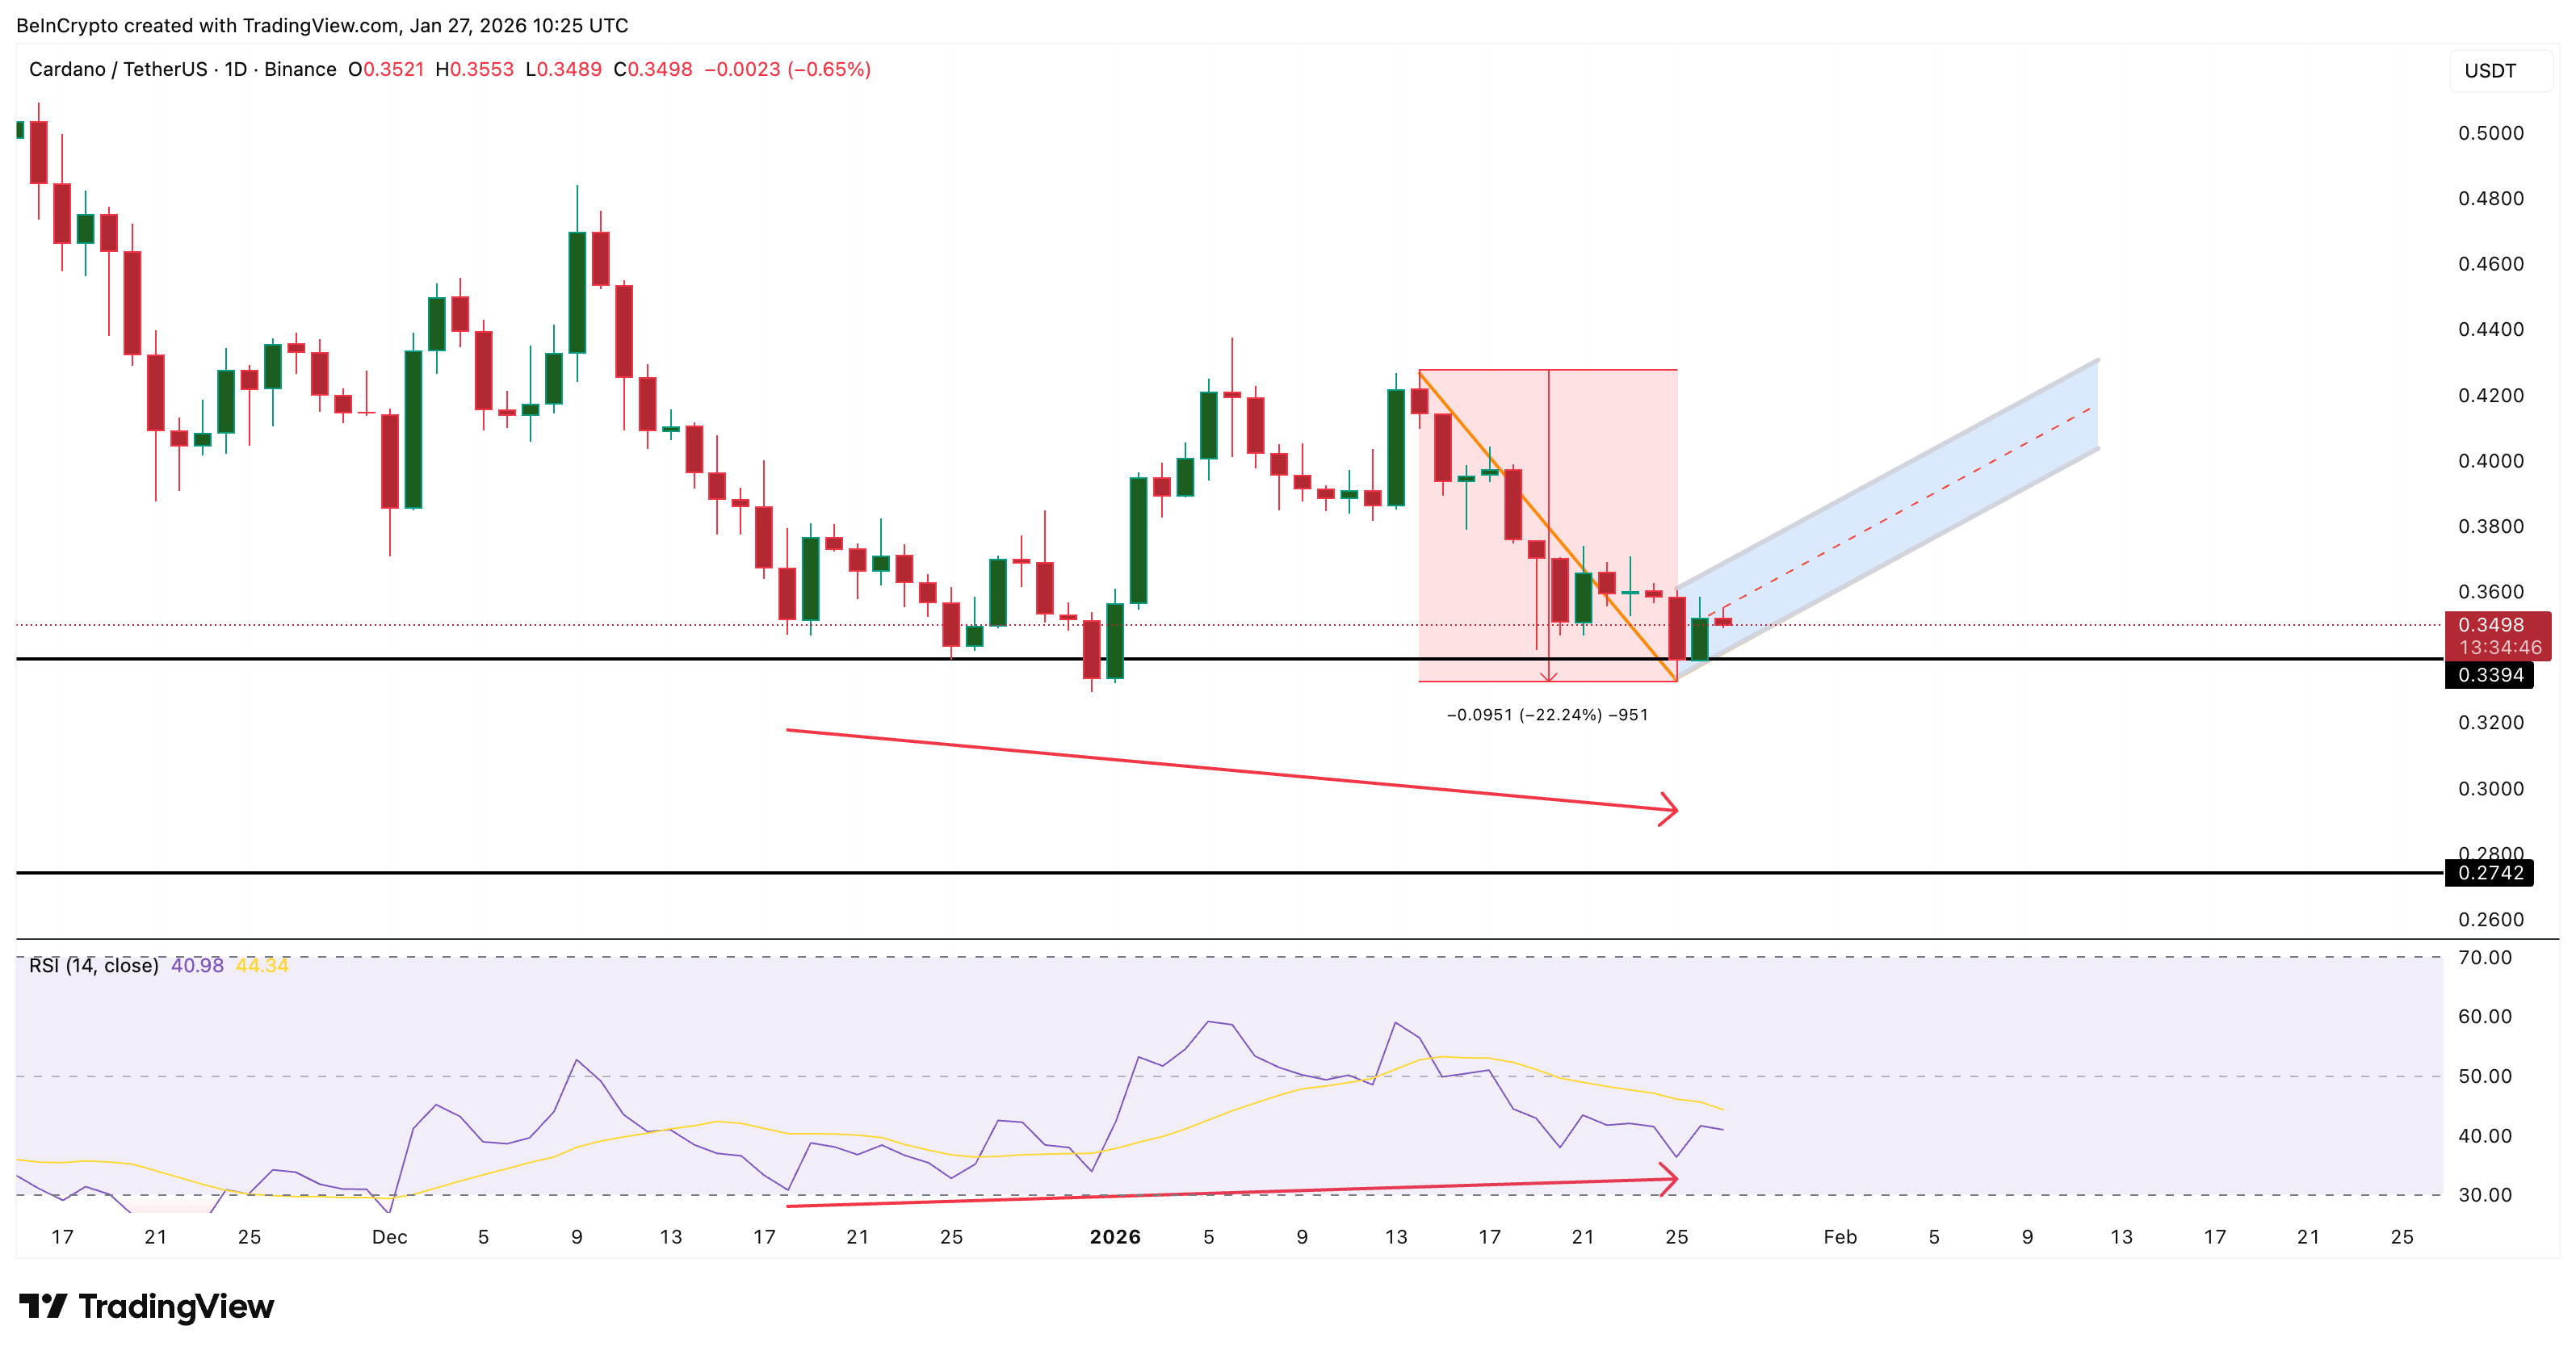
That is a standard bullish divergence. It suggests sellers are losing control, even though the price still looks weak. These signals often appear before trend reversals, not after them. When the lower low formed, the ADA price corrected over 20% as part of the bear pole. The recent consolidation formed the bear flag, but the RSI strength and whale accumulation pattern suggest the breakdown might not actually occur.
The second signal comes from MFI, or Money Flow Index. MFI tracks whether money is flowing into or out of an asset by combining price and volume. Between January 21 and January 26, the price continued drifting lower. MFI moved higher.
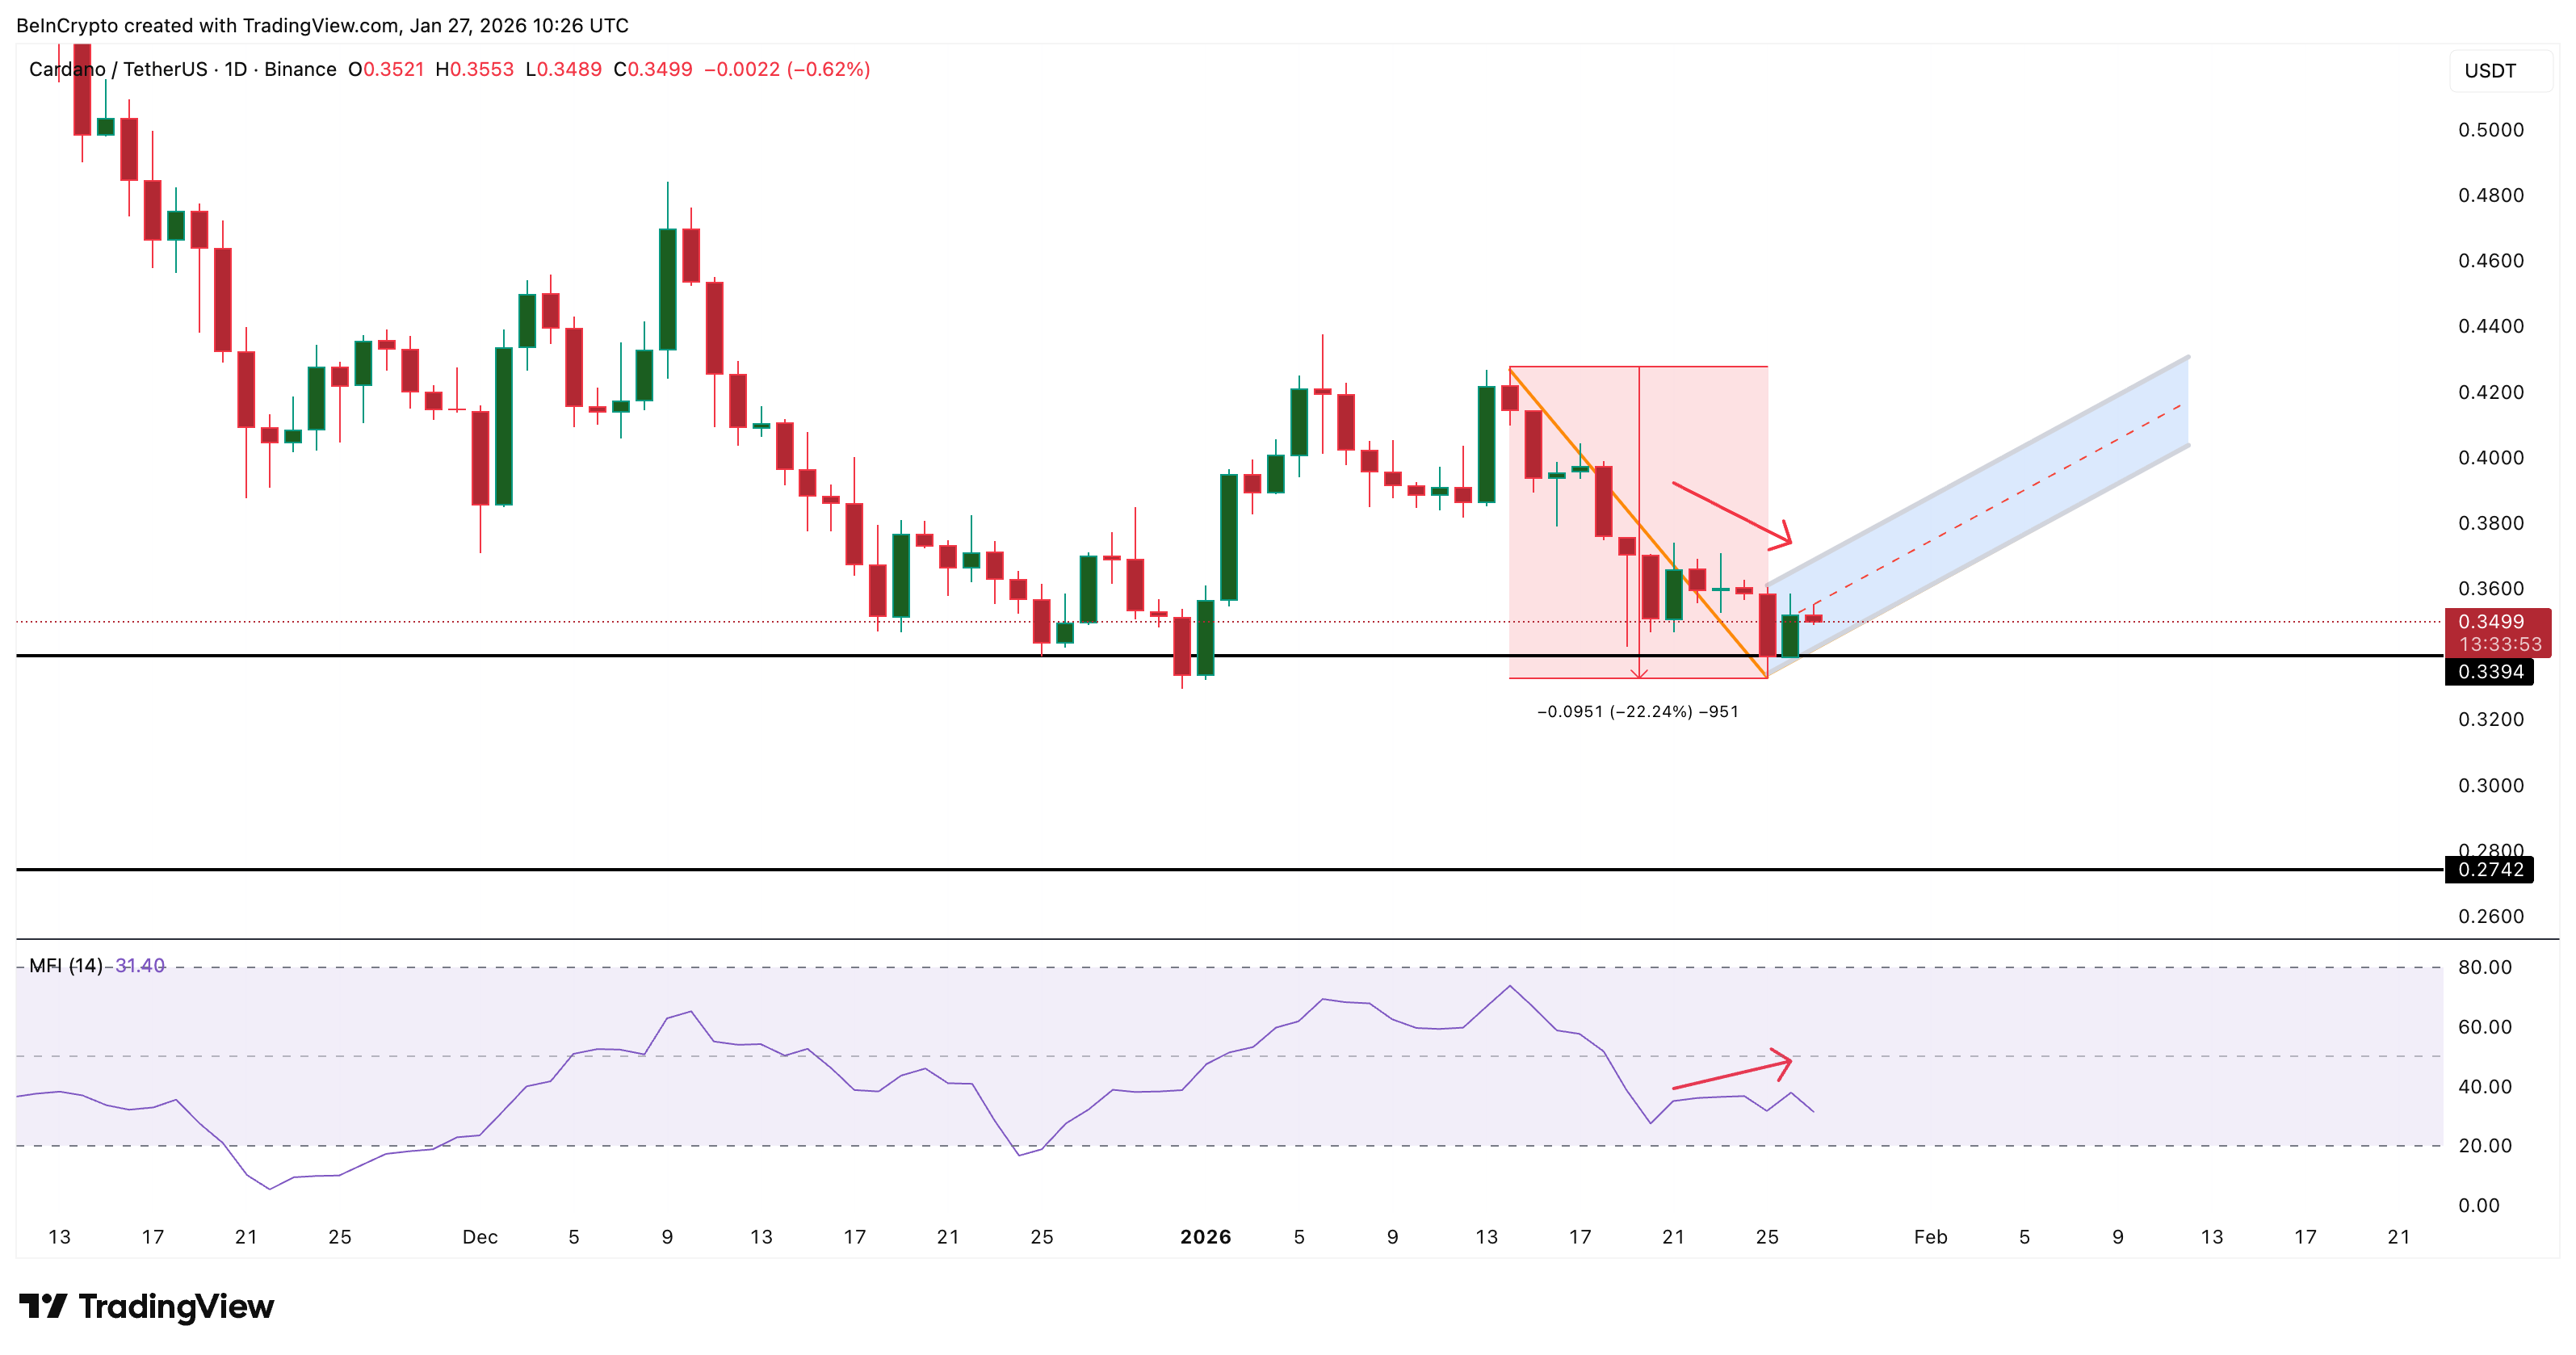
This tells us something important. The dip was being bought. While price fell, money flowed in, not out. That supports what wallet data already showed. Big money was active during the drop, not waiting on the sidelines.
When RSI shows momentum stabilizing, and MFI shows active dip buying, the odds of a clean breakdown fall. It does not guarantee a rally. But it strongly weakens the bearish case.
Cardano Price Levels That Decide the Next Move
With accumulation and momentum signals in place, the Cardano price levels now matter most.
ADA is currently trading near $0.35. The first big technical hurdle sits near $0.390. That zone marks roughly half of the prior drop and aligns with a critical Fibonacci level. A move above this area would invalidate the bearish flag structure on the daily chart.
However, the first real resistance has to be the 20-day EMA, or exponential moving average. An EMA gives more weight to recent prices and helps track short-term trend direction. The last time ADA reclaimed this EMA, on January 2, the price rallied over 17%.
If ADA closes above the 20-day EMA again, momentum could shift quickly. In that case, upside levels near $0.427 and even $0.484 come back into focus.
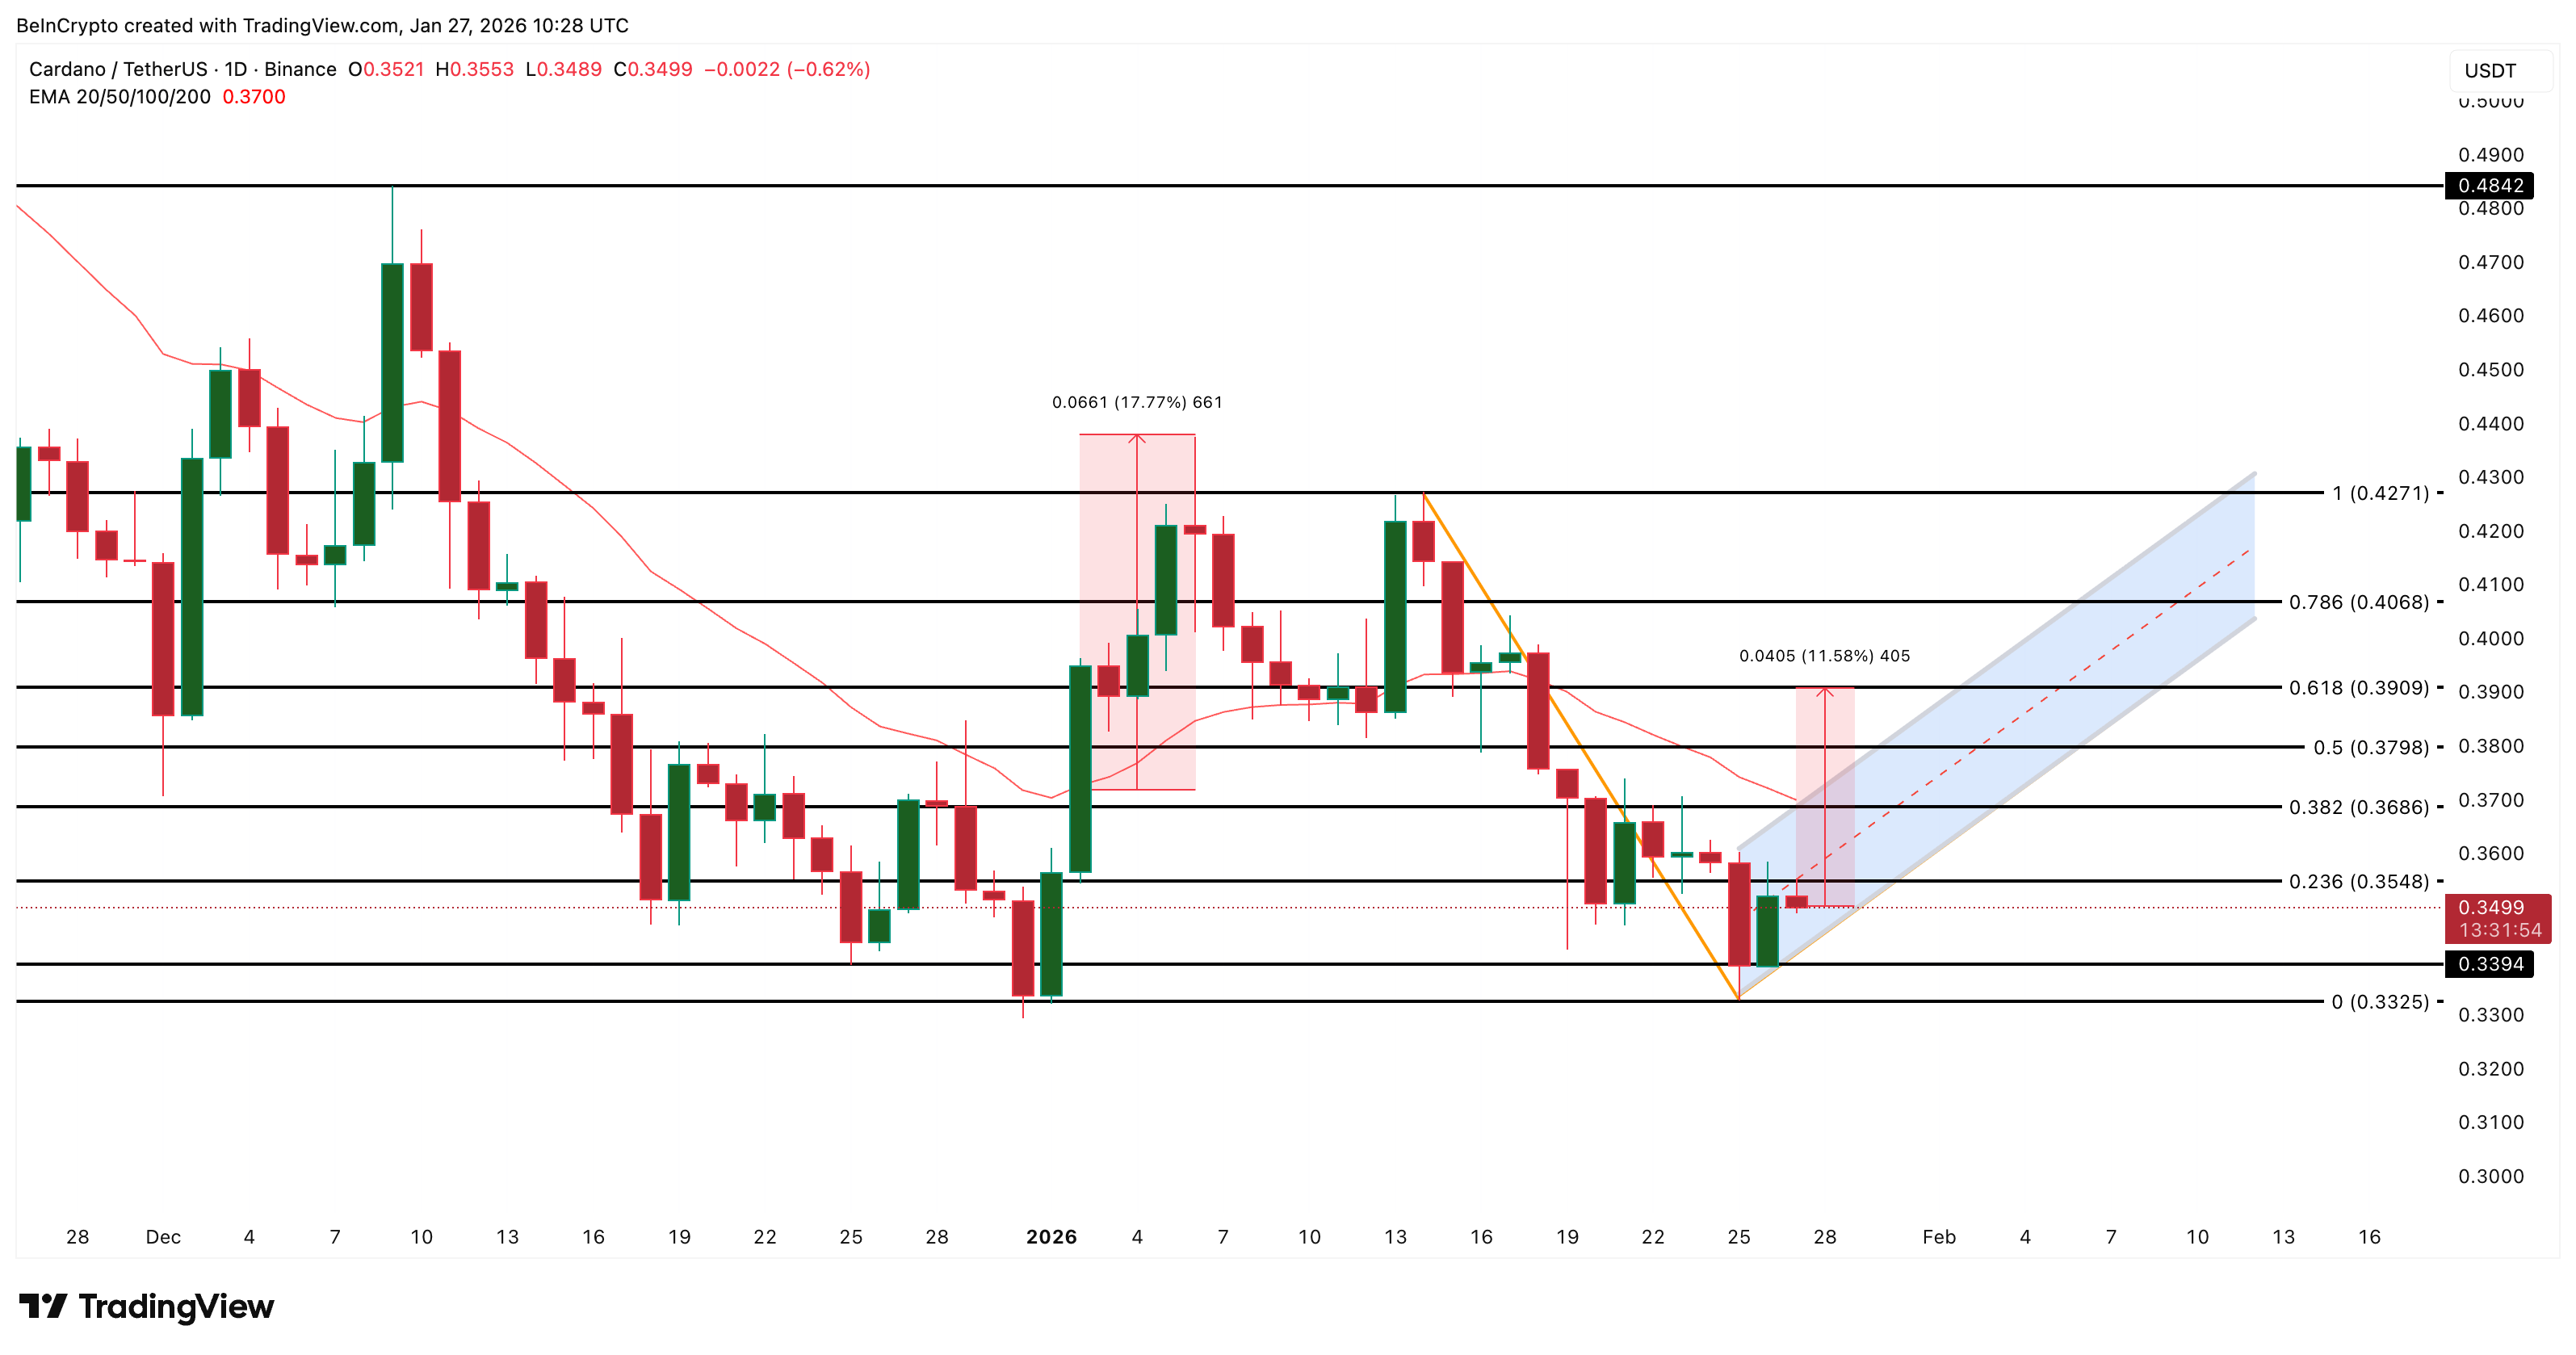
On the downside, risk remains. A daily close below $0.339 would weaken the recovery case. A break under $0.332 would invalidate the bullish divergence setup and reopen downside risk.
For now, the message is clear. The 20% drop did not scare big money away. It pulled them in. Two bullish metrics show why. Whether price follows through depends on the next few daily closes.
The post One Reversal Hope Explains Why Big Money Bought the 20% Cardano (ADA) Price Dip appeared first on BeInCrypto.

