


 8
8
Shiba Inu has slipped further as traders continue to watch a key trend indicator, with volatility easing and funding rates slightly positive.
Shiba Inu (SHIB) has changed hands slightly lower over the past 24 hours, down about 0.8% to around $0.000007695. The 24-hour range sits near $0.000007414–$0.000007787, with price sliding from the upper band into the day’s low before rebounding and stabilizing back around the mid-to-upper part of the range.
Broader performance remains mixed: SHIB has dropped about 2.1% over the last 7 days and 9.2% in the past 14 days, but still up roughly 7.4% over 30 days. The next question is whether buyers can turn this rebound into a clean breakout.
What’s Next for Shiba Inu?
On Shiba Inu’s daily chart extracted from TradingView, the Supertrend remains bearish, with the indicator plotted above price and the Supertrend level sitting near $0.00000889. This positioning typically signals that the broader trend bias has shifted lower until SHIB can reclaim the Supertrend line and trigger a flip back to bullish.
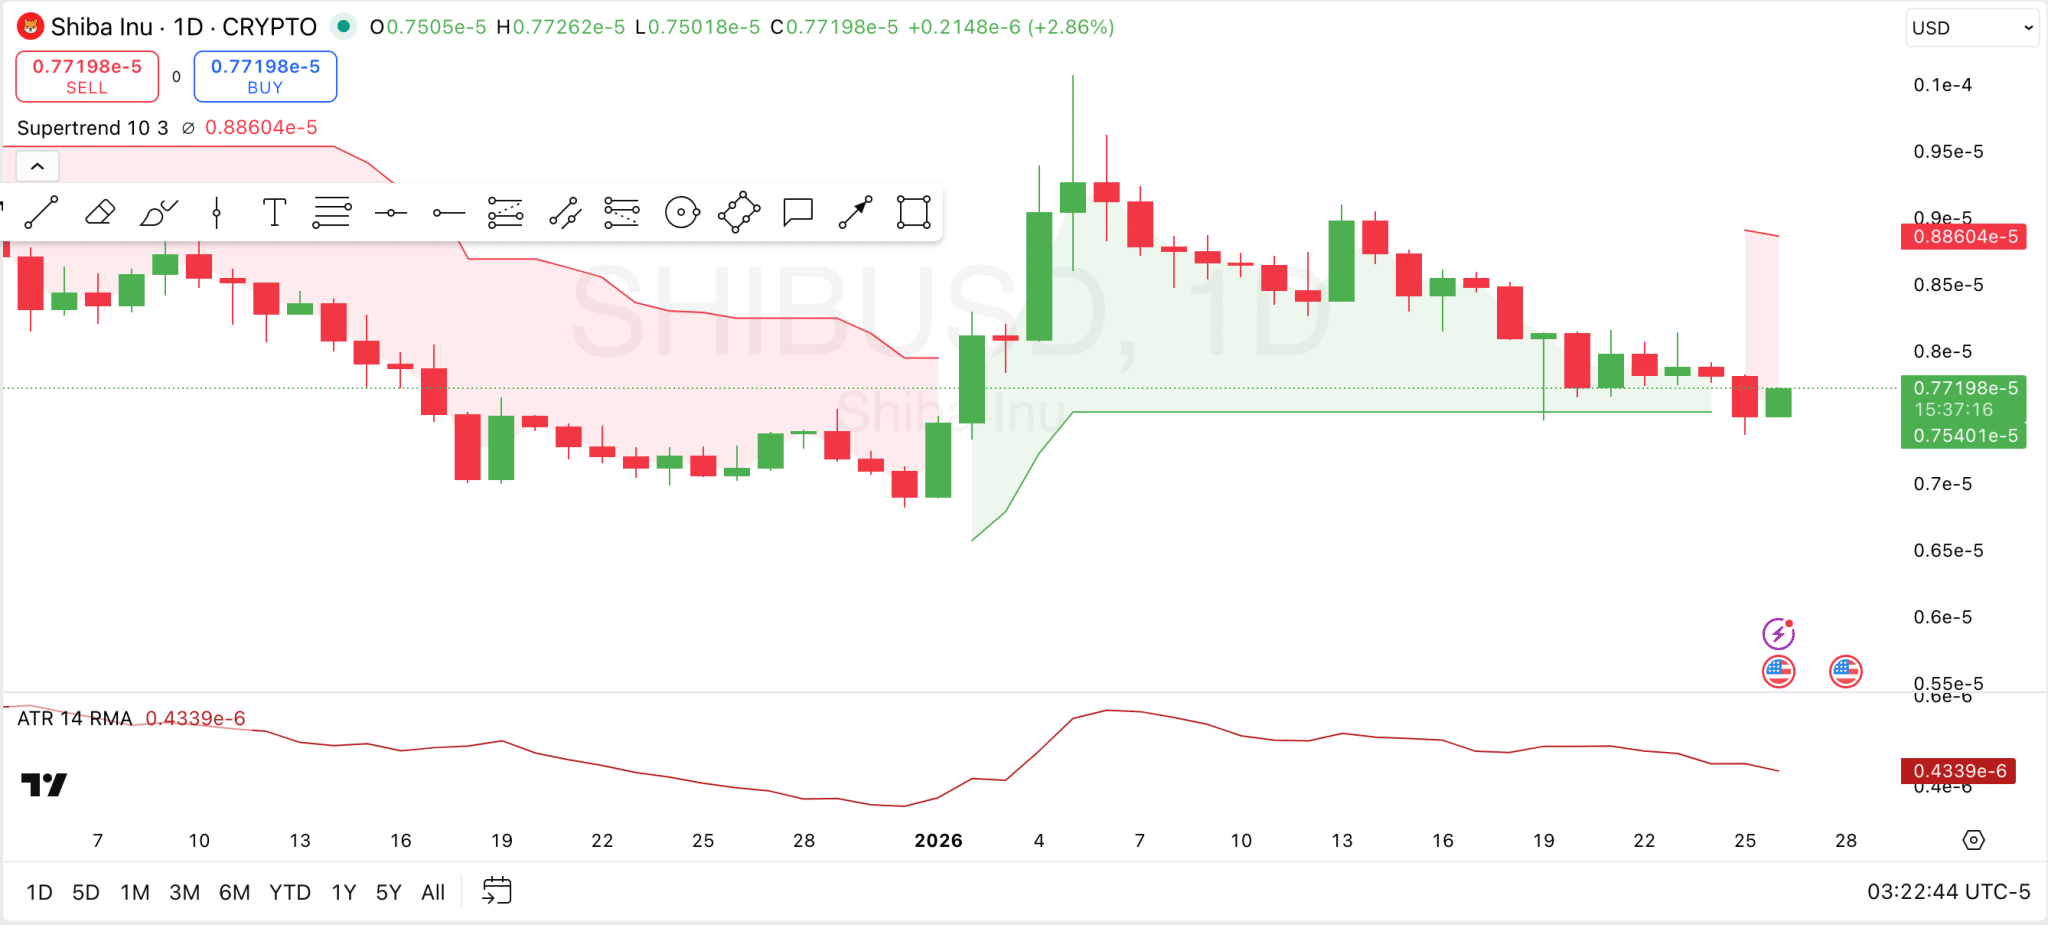
Volatility indicators also point to a calmer tape. Specifically, the Average True Range is trending lower (around 0.0000004339), suggesting daily ranges have compressed after the bigger swings earlier in the month. Falling ATR often coincides with consolidation, and it can set the stage for a sharper move once direction returns.
In terms of practical levels visible on the chart, the early January base around $0.00000683 is the near-term support zone to watch. On the other side, the $0.00000887 Supertrend line marks the key overhead hurdle that would need to break for momentum to shift more decisively.
Shiba Inu OI-Weighted Funding Rate
Elsewhere, Shiba Inu’s OI-weighted funding rate has spent much of the period oscillating around the zero line, with frequent flips between positive and negative readings. In early January, the funding rate shifted more consistently positive alongside a short-lived price rebound, suggesting longs were paying shorts as leverage leaned more bullish.
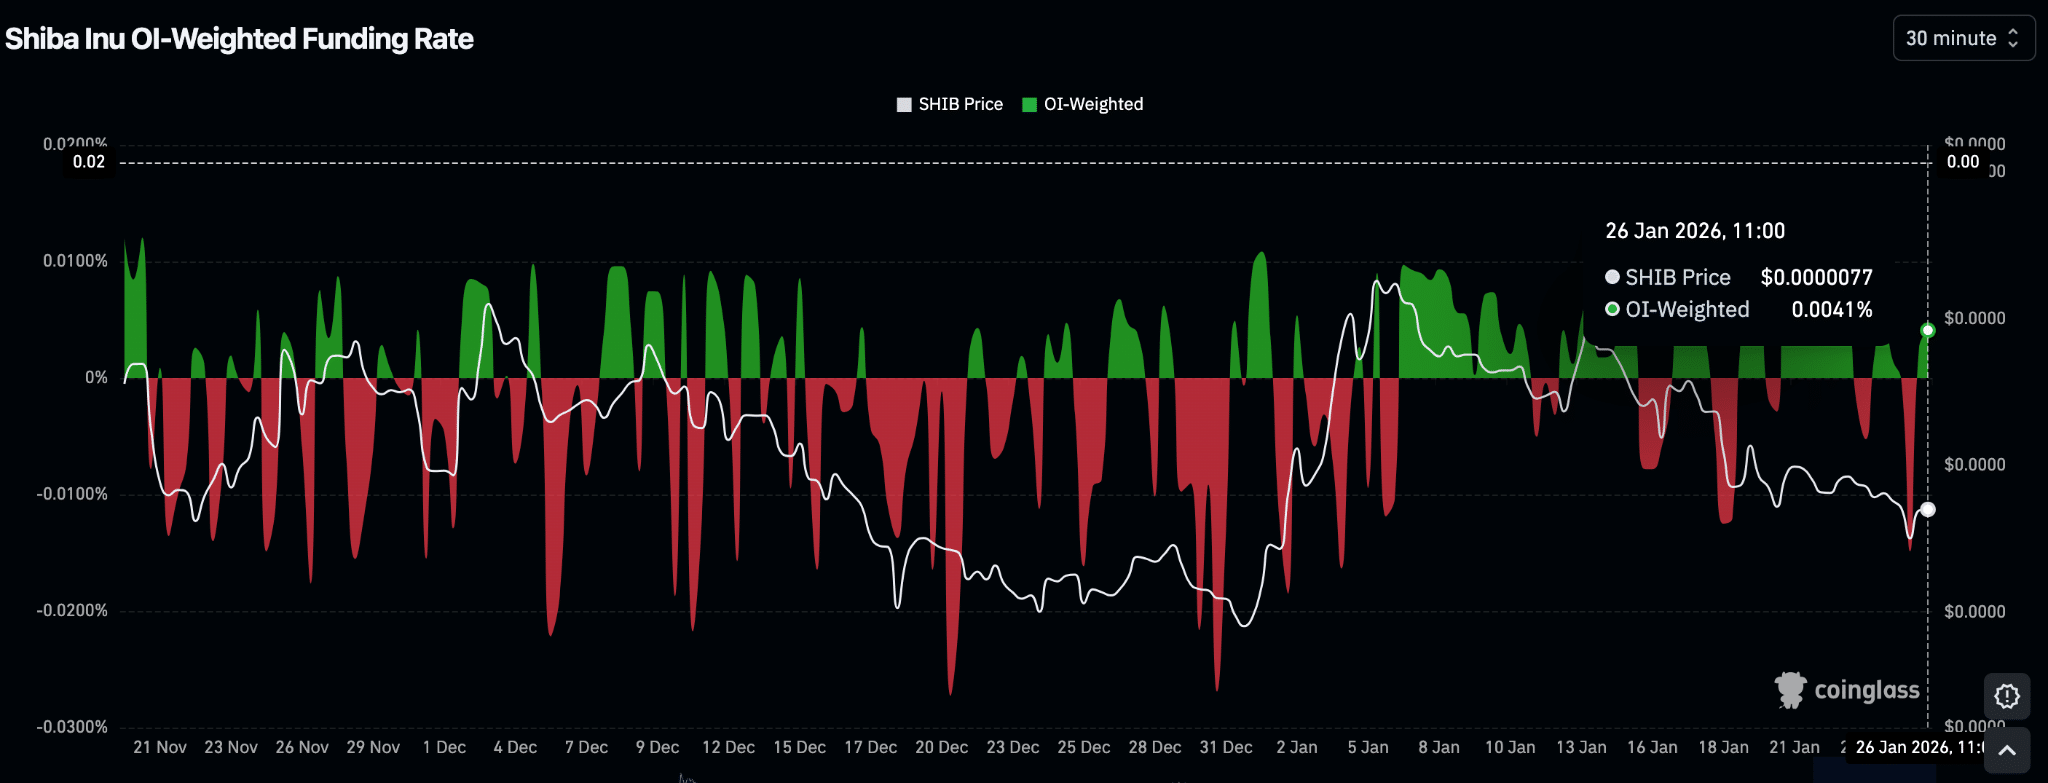
More recently, the chart shows SHIB’s price easing while the funding rate returns close to flat, before ticking slightly positive at the latest data point (around 0.0041%). This means that the price moves are less likely to be driven by an aggressive one-sided derivatives trade, unless funding begins to trend persistently higher or sharply lower.
