


 24
24
Cardano nears record lows against Bitcoin amid prolonged price consolidation, but history offers context for subsequent price action.
Notably, altcoins in general have recorded steeper declines than Bitcoin amid occasional corrections during a mild bullish season for the crypto industry. Particularly, this has forced Cardano near multi-year lows against the pioneering cryptocurrency.
Key Points
- Cardano nears record lows against Bitcoin amid prolonged price consolidation.
- At the time of writing, it trades at 0.00000405, up 1% since the start of the week.
- However, on a broader scope, the pair has been trending downward persistently since the 2021 high of 0.00006271.
- This states the obvious: Cardano has underperformed compared to Bitcoin this cycle.
- A look at the historical $ADA/$BTC chart shows that Cardano’s price has often reacted a certain way around these record low levels.
- If history repeats, Cardano could start another bullish phase against $BTC.
$ADA/$BTC Chart Bottoms
TradingView data shows that the $ADA/$BTC pair trades near record lows. At the time of writing, it changes hands for 0.00000405, up 1% since the start of the week.
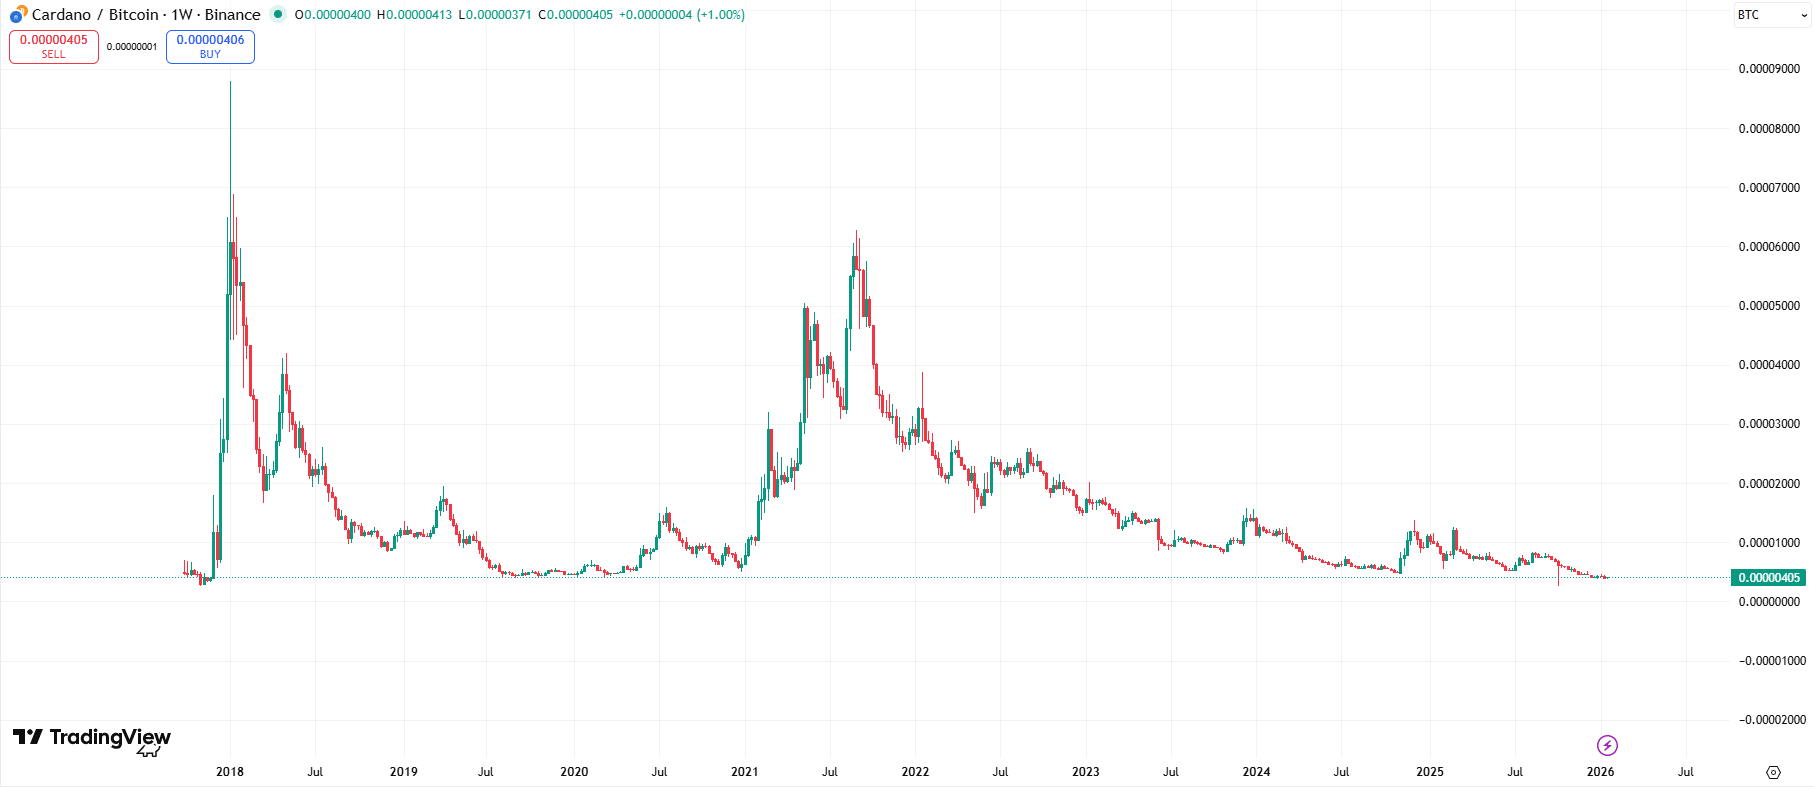
However, on a broader scope, the pair has been on a downward trend since the 2021 high of 0.00006271. During the August 2021 peak, Cardano trounced Bitcoin’s performance, hitting its current all-time high of $3.10.
Nearly five years later, $ADA/$BTC has capitulated by 93.5% and is trading near historical lows. Data shows that the only time the pair collapsed further than this was in October 2017, when it reached a record bottom of 0.00000266.
Notably, this states the obvious: Cardano has underperformed compared to Bitcoin. The crypto leader reached new highs this cycle, surpassing its 2021 high of $69,000 before the 2024 halving to set new all-time highs. It peaked at $126,200 in October 2025 before consolidating.
By contrast, $ADA failed to sustainably trade above $1 and didn’t retest its 2021 peak of $3.10. This explains the downward trend in the $ADA/$BTC chart and summarizes the bull cycle of most altcoins.
How Has Cardano Historically Reacted to Such Low
Analysts turn to history to understand patterns and predict possible future outcomes. As the saying goes, history does not always repeat but often rhymes.
A look at the historical $ADA/$BTC chart shows that Cardano’s price has often reacted a certain way around these record low levels. Specifically, it usually gains strength around this bottom, leading a Cardano rally against Bitcoin.
For context, after the 2017 record lows, Cardano regained bullish momentum, rallying to its January 2018 high of $1.32. After the bullish phase, $ADA entered another severe consolidation phase against Bitcoin before breaking out in the 2021 cycle.
After reaching lows of 0.0000040, the $ADA/$BTC pair bounced to the August 2021 high of 0.000062, pushing Cardano’s price with it. During this period, Bitcoin consolidated or grew slightly, while $ADA surged comprehensively.
Important Caveat to Note
If history repeats, Cardano could start another bullish phase against $BTC. However, this remains speculative, and there is no guarantee of its occurrence.
Moreover, cycles have changed in the wake of institutional presence, and Bitcoin has been a preferred choice, which explains its dominance throughout this bull season. Capital relocation has been crucial to the previous altcoin seasons, and whales have not done that, at least so far this cycle.
Additionally, while Cardano might rally, it does not mean that Bitcoin will correct. Both might rebound, with $ADA performing better.
