


 18
18
The current consolidatory momentum has seen Cardano retest a key descending trendline, creating two possible price scenarios.
Notably, the recent leg down has pushed Cardano to the neckline resistance from which it broke out, following its early January rally to $0.43. While this opens up an optimistic possibility, failure to hold this level could mark a notable price turnaround.
Key Points
- Cardano previously broke above a descending trendline that had suppressed its price since October 2025, following its over 30% rally in the first six days of 2026.
- However, the current pullback has seen Cardano retest the descending trendline, creating two possible price scenarios.
- If the retest level holds, then another wave of bullish price action could follow for Cardano.
- The key levels to watch if the current downside pressure persists are the demand zones at $0.329 and $0.278.
Cardano Retests Breakout Point
Notably, Cardano broke out from a descending trendline that had suppressed its price since October 2025, following its over 30% rally in the first six days of 2026. However, as is typical of most breakouts, a retest has ensued.
A mixture of a broader market bearish trend and a structured technical move has drawn $ADA back to the breakout area. Specifically, the Monday dump to $0.34 saw the coin retreat to the former neckline resistance and rebound.
If this level holds, another wave of bullish price action could follow. However, this remains subject to the broader market trend, which is difficult to predict.
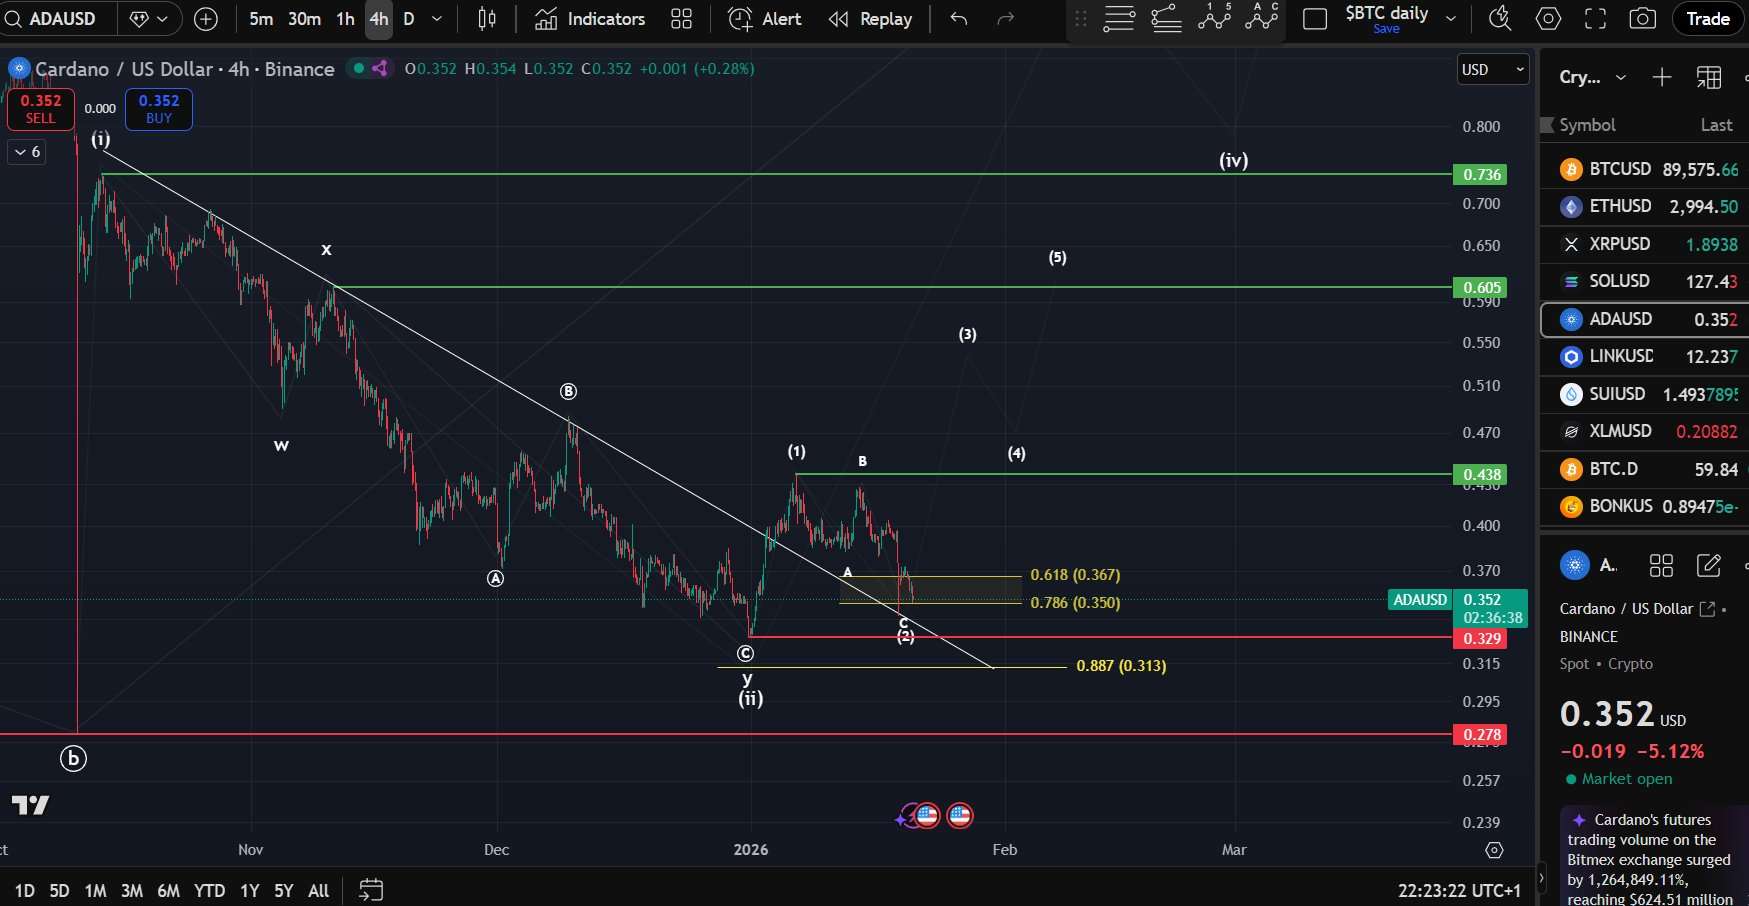
Interestingly, the breakout also marked the first wave of a five-wave Elliot Wave pattern. If Cardano gains momentum above this breakout point, the January 19 drop would mark the end of the corrective wave 2.
Key Areas $ADA Could Retest
Currently, momentum looks weak, and prices may trend lower. The key levels to watch if the downside pressure persists are the demand zones at $0.329 and $0.278.
On the upside, a successful retest could see Cardano retest the early January high and its former lower highs within the descending trendline. The levels include $0.43, the November 11 high of $0.60, and the October 13 peak price of $0.73.
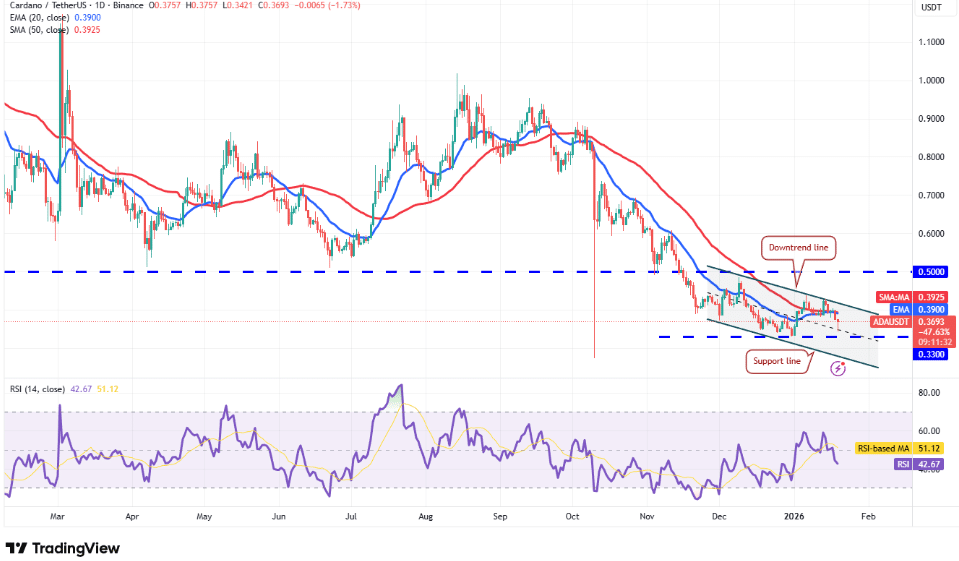
A separate 1D chart analysis also confirms this. If $ADA breaks the $0.33 support, it will retest $0.27. However, a bounce from the support could take the asset towards the $0.50 price level.
It is worth noting that this is an analytical exposition, not financial advice.