


 24
24
Shiba Inu tests key support after a sharp drop, with traders watching whether SHIB can reclaim the 0.618 Fibonacci level to stabilize price.
Shiba Inu’s (SHIB) price has experienced a significant drop of 5.9% in the last 24 hours, falling from $0.00000845 to the current $0.000007874, which highlights a sudden market downturn. This sharp decline coincides with rising market volatility, as reflected by the sudden surge in trading volume, up over 108%, and the negative price action.
Further, SHIB has faced significant volatility over the past week, with its price dropping by 6.5% within this period. Over the 14 days, the loss is slightly less severe at 9.5%, which shows that the selling pressure has been persistent, with the coin failing to find solid support at key levels.
Looking at a 30-day window, Shiba Inu is still up by 5.4%, indicating that its longer-term performance remains positive despite recent losses. Can this dip be part of a consolidation phase rather than a long-term reversal?
Shiba Inu Prediction
On the technical analysis side, SHIB has now tested the 0.786 Fib retracement $0.0000075162. So far, price is still holding above that band, but the bounce has not been confirmed yet because it has not reclaimed the 0.618 level at $0.0000080620. In practical terms, the 0.786 test shows buyers are still defending the retracement zone, but the structure remains weak until the market proves it can lift back above 0.618.
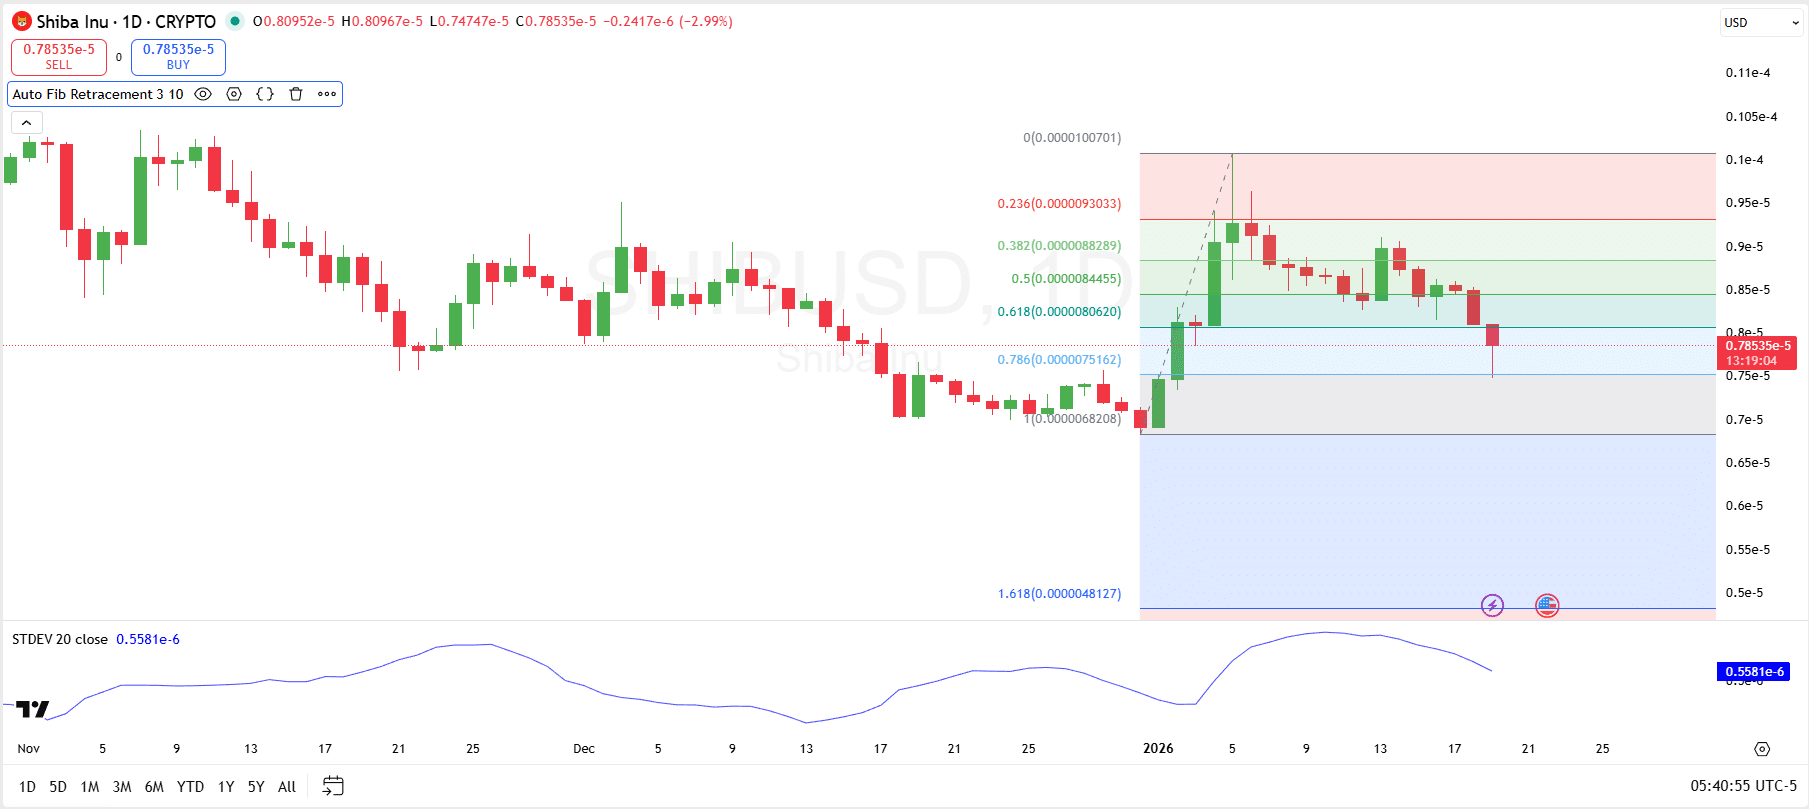
For the setup to shift back to bullish, SHIB needs a daily close above 0.618. That would signal that demand is strong enough to break out of the deeper retracement area and re-enter the higher Fib range.
If that close happens, the next upside checkpoints typically become 0.5 at $0.0000084455 and 0.382 at $0.0000088289. However, if SHIB fails to reclaim 0.618 and rolls over again, repeated pressure on 0.786 increases the risk of a breakdown back toward the prior swing low area.
Shiba Inu Futures Flow
Elsewhere, the Shiba Inu Futures Flow data reveals a volatile market with mixed sentiments across different time frames. Over the 1-hour and 4-hour periods, the market is experiencing significant outflows, indicating bearish sentiment, especially in the immediate short term.
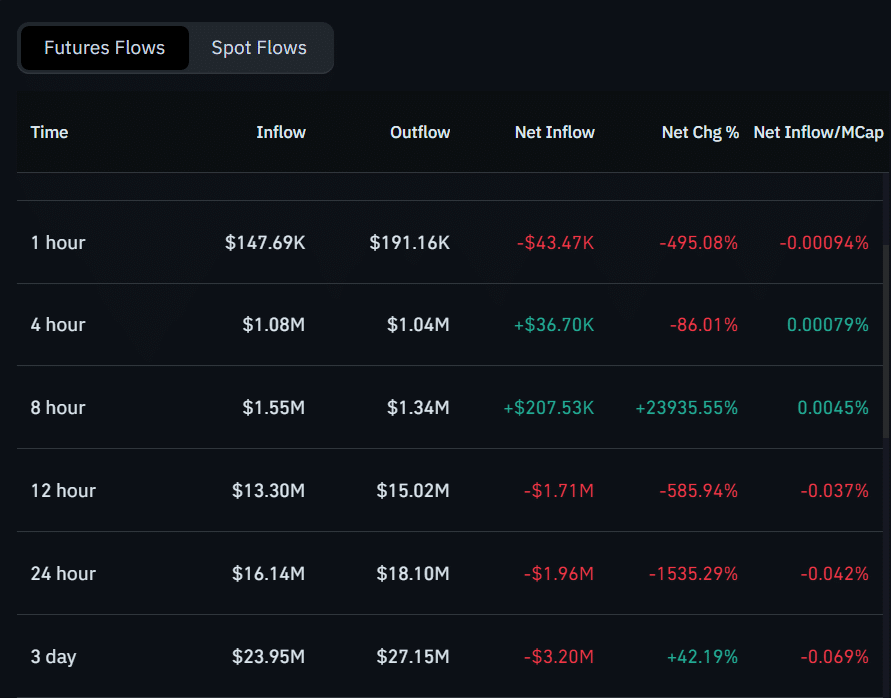
The 1-hour shows a 495.08% drop in net inflow, while the 4-hour data, despite a small net inflow of $36.7K, reflects only a modest recovery with a 86% drop.
However, the 8-hour data stands out with a sharp 23935.55% increase in net inflow. The 12-hour and 24-hour periods show continued outflows of $1.71M and $1.96M, signaling persistent bearishness over the medium to long term. Ultimately, the 3-day figures show a smaller net outflow of $3.2M.
