


 21
21
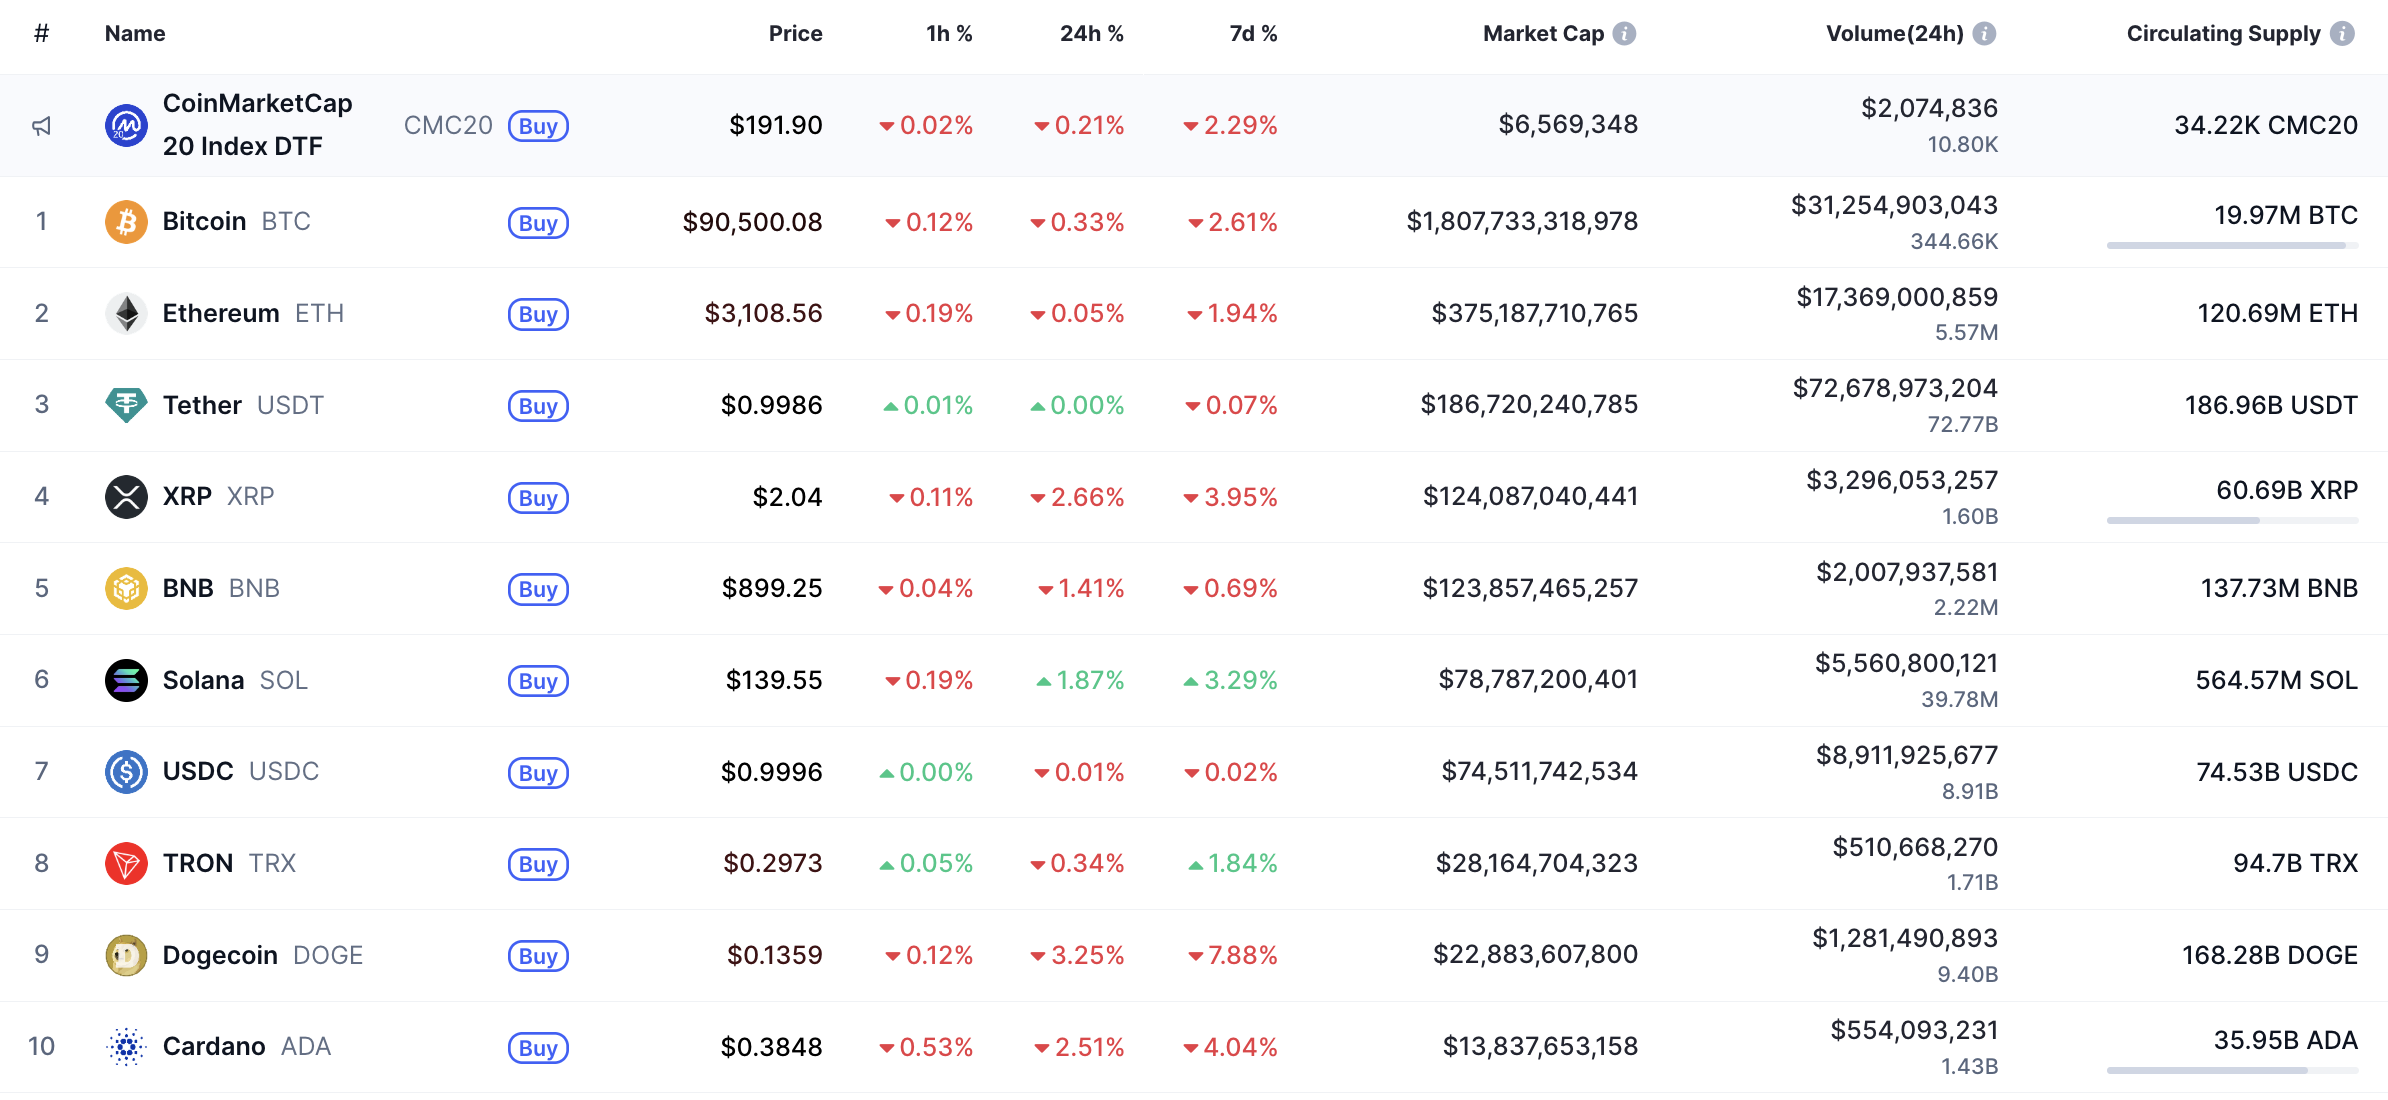
The market has quickly changed to red after the weekend's growth, according to CoinMarketCap.
SOL/USD
Solana (SOL) is the exception to the rule, rising by 1.87% over the past day.
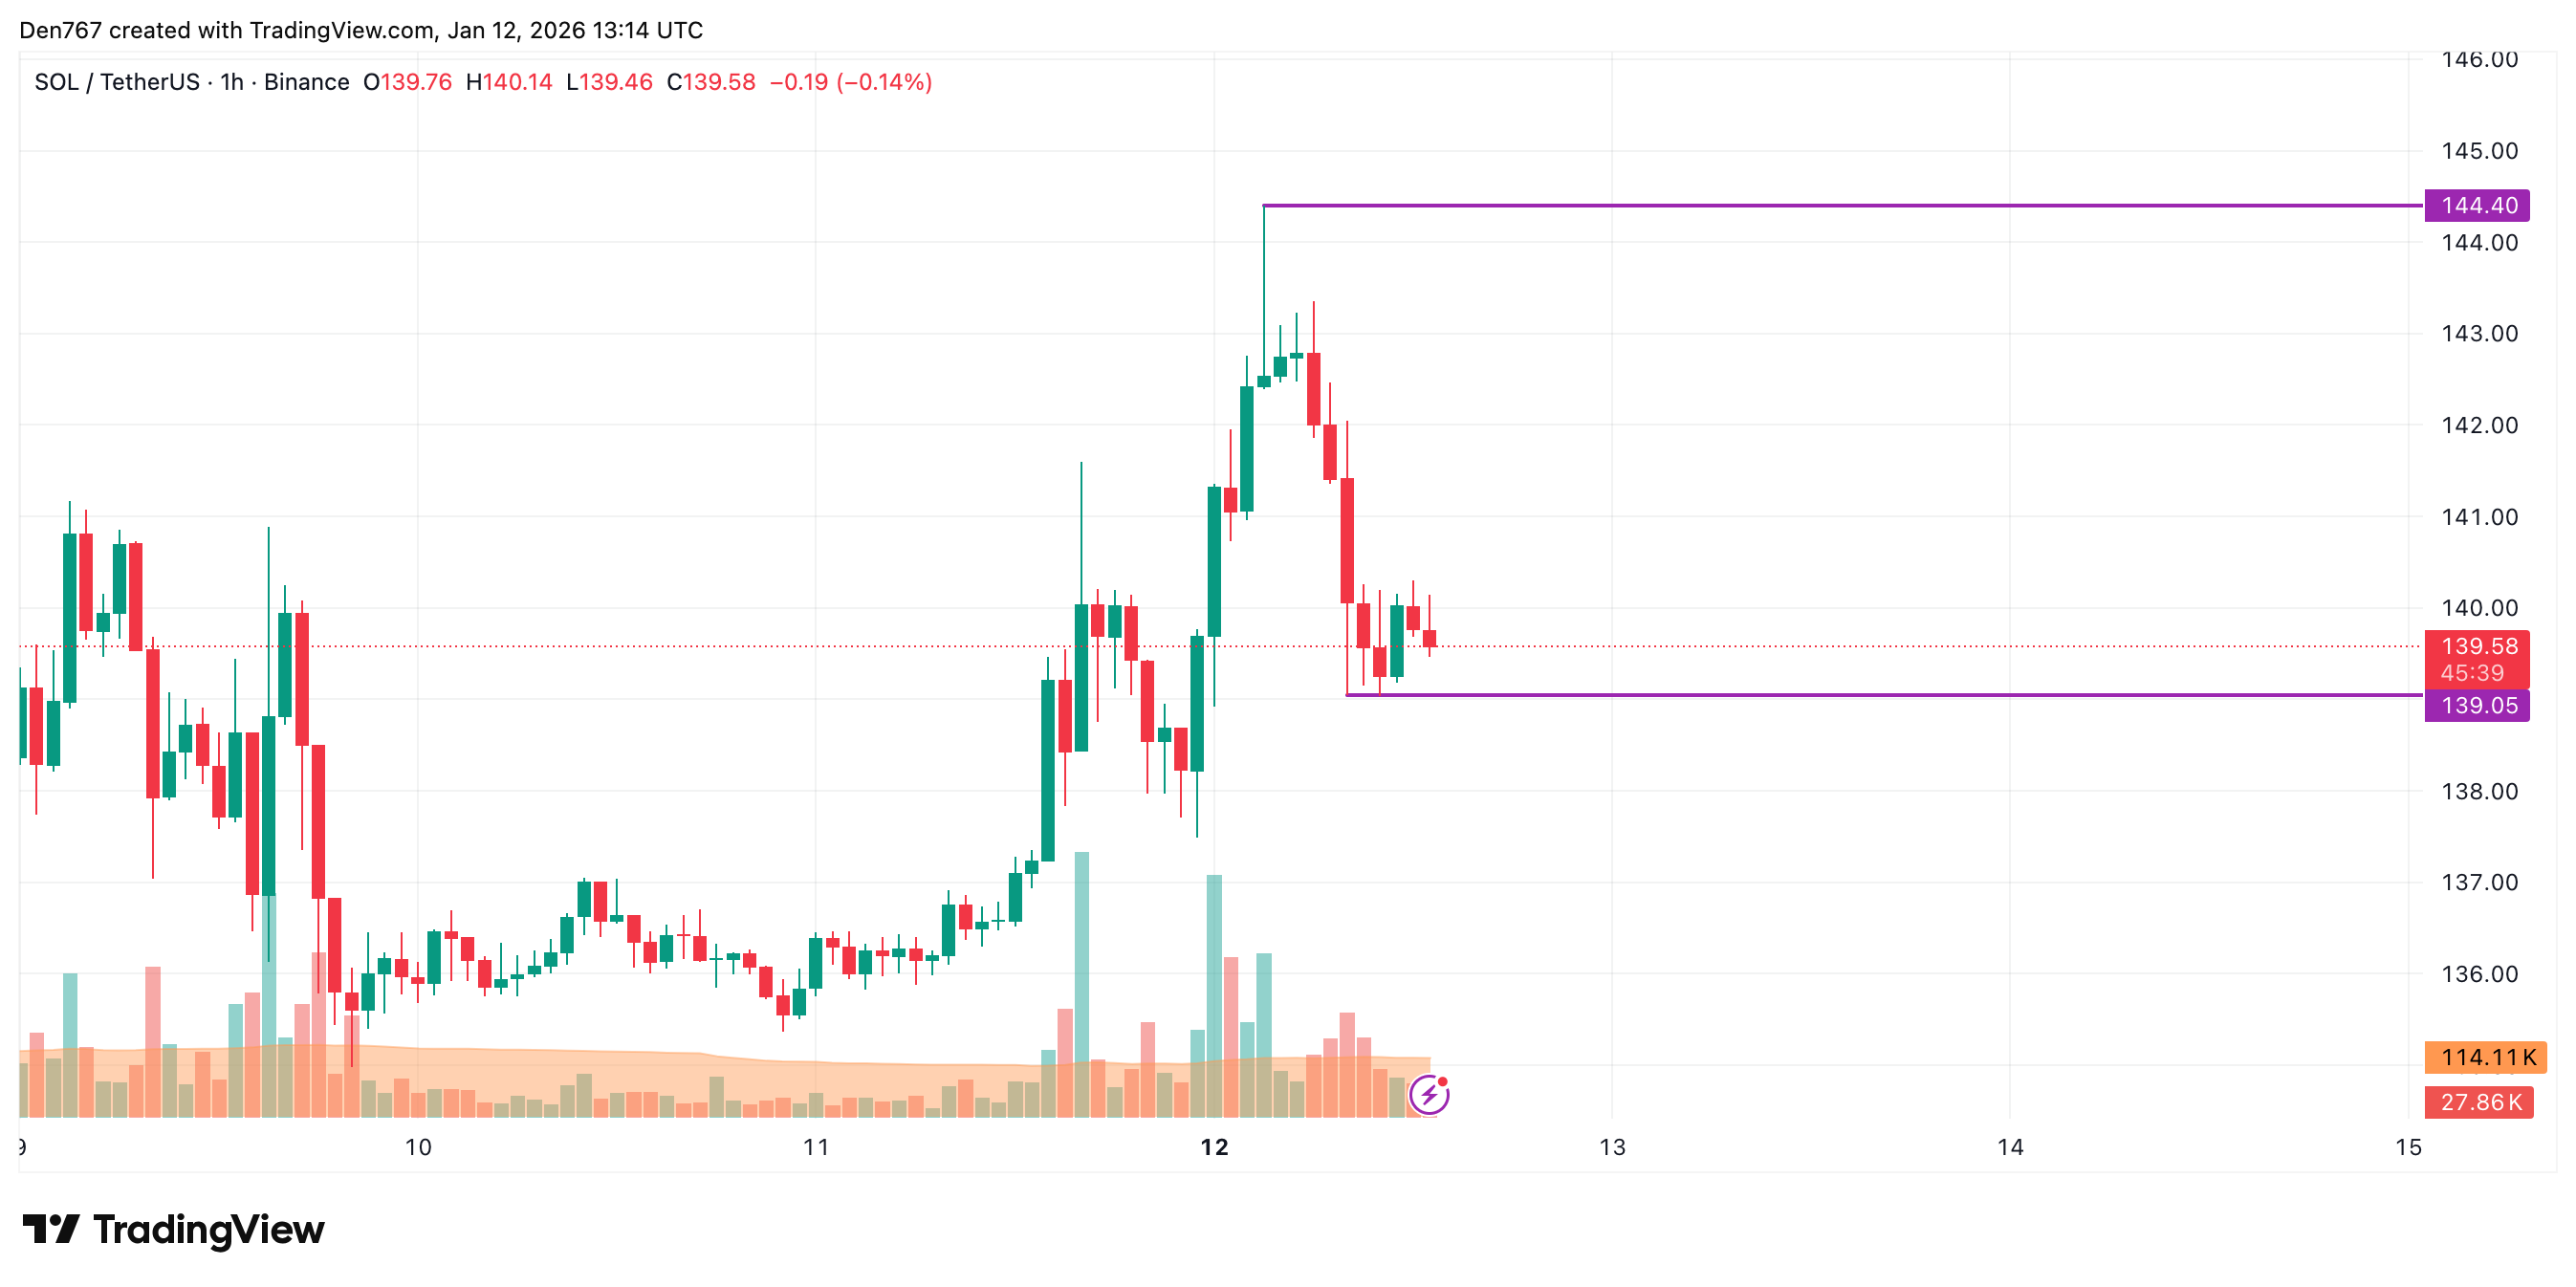
On the hourly chart, the rate of SOL is near the local support at $139.05. If a bounce back does not happen, traders may expect a further correction to the $138 zone tomorrow.
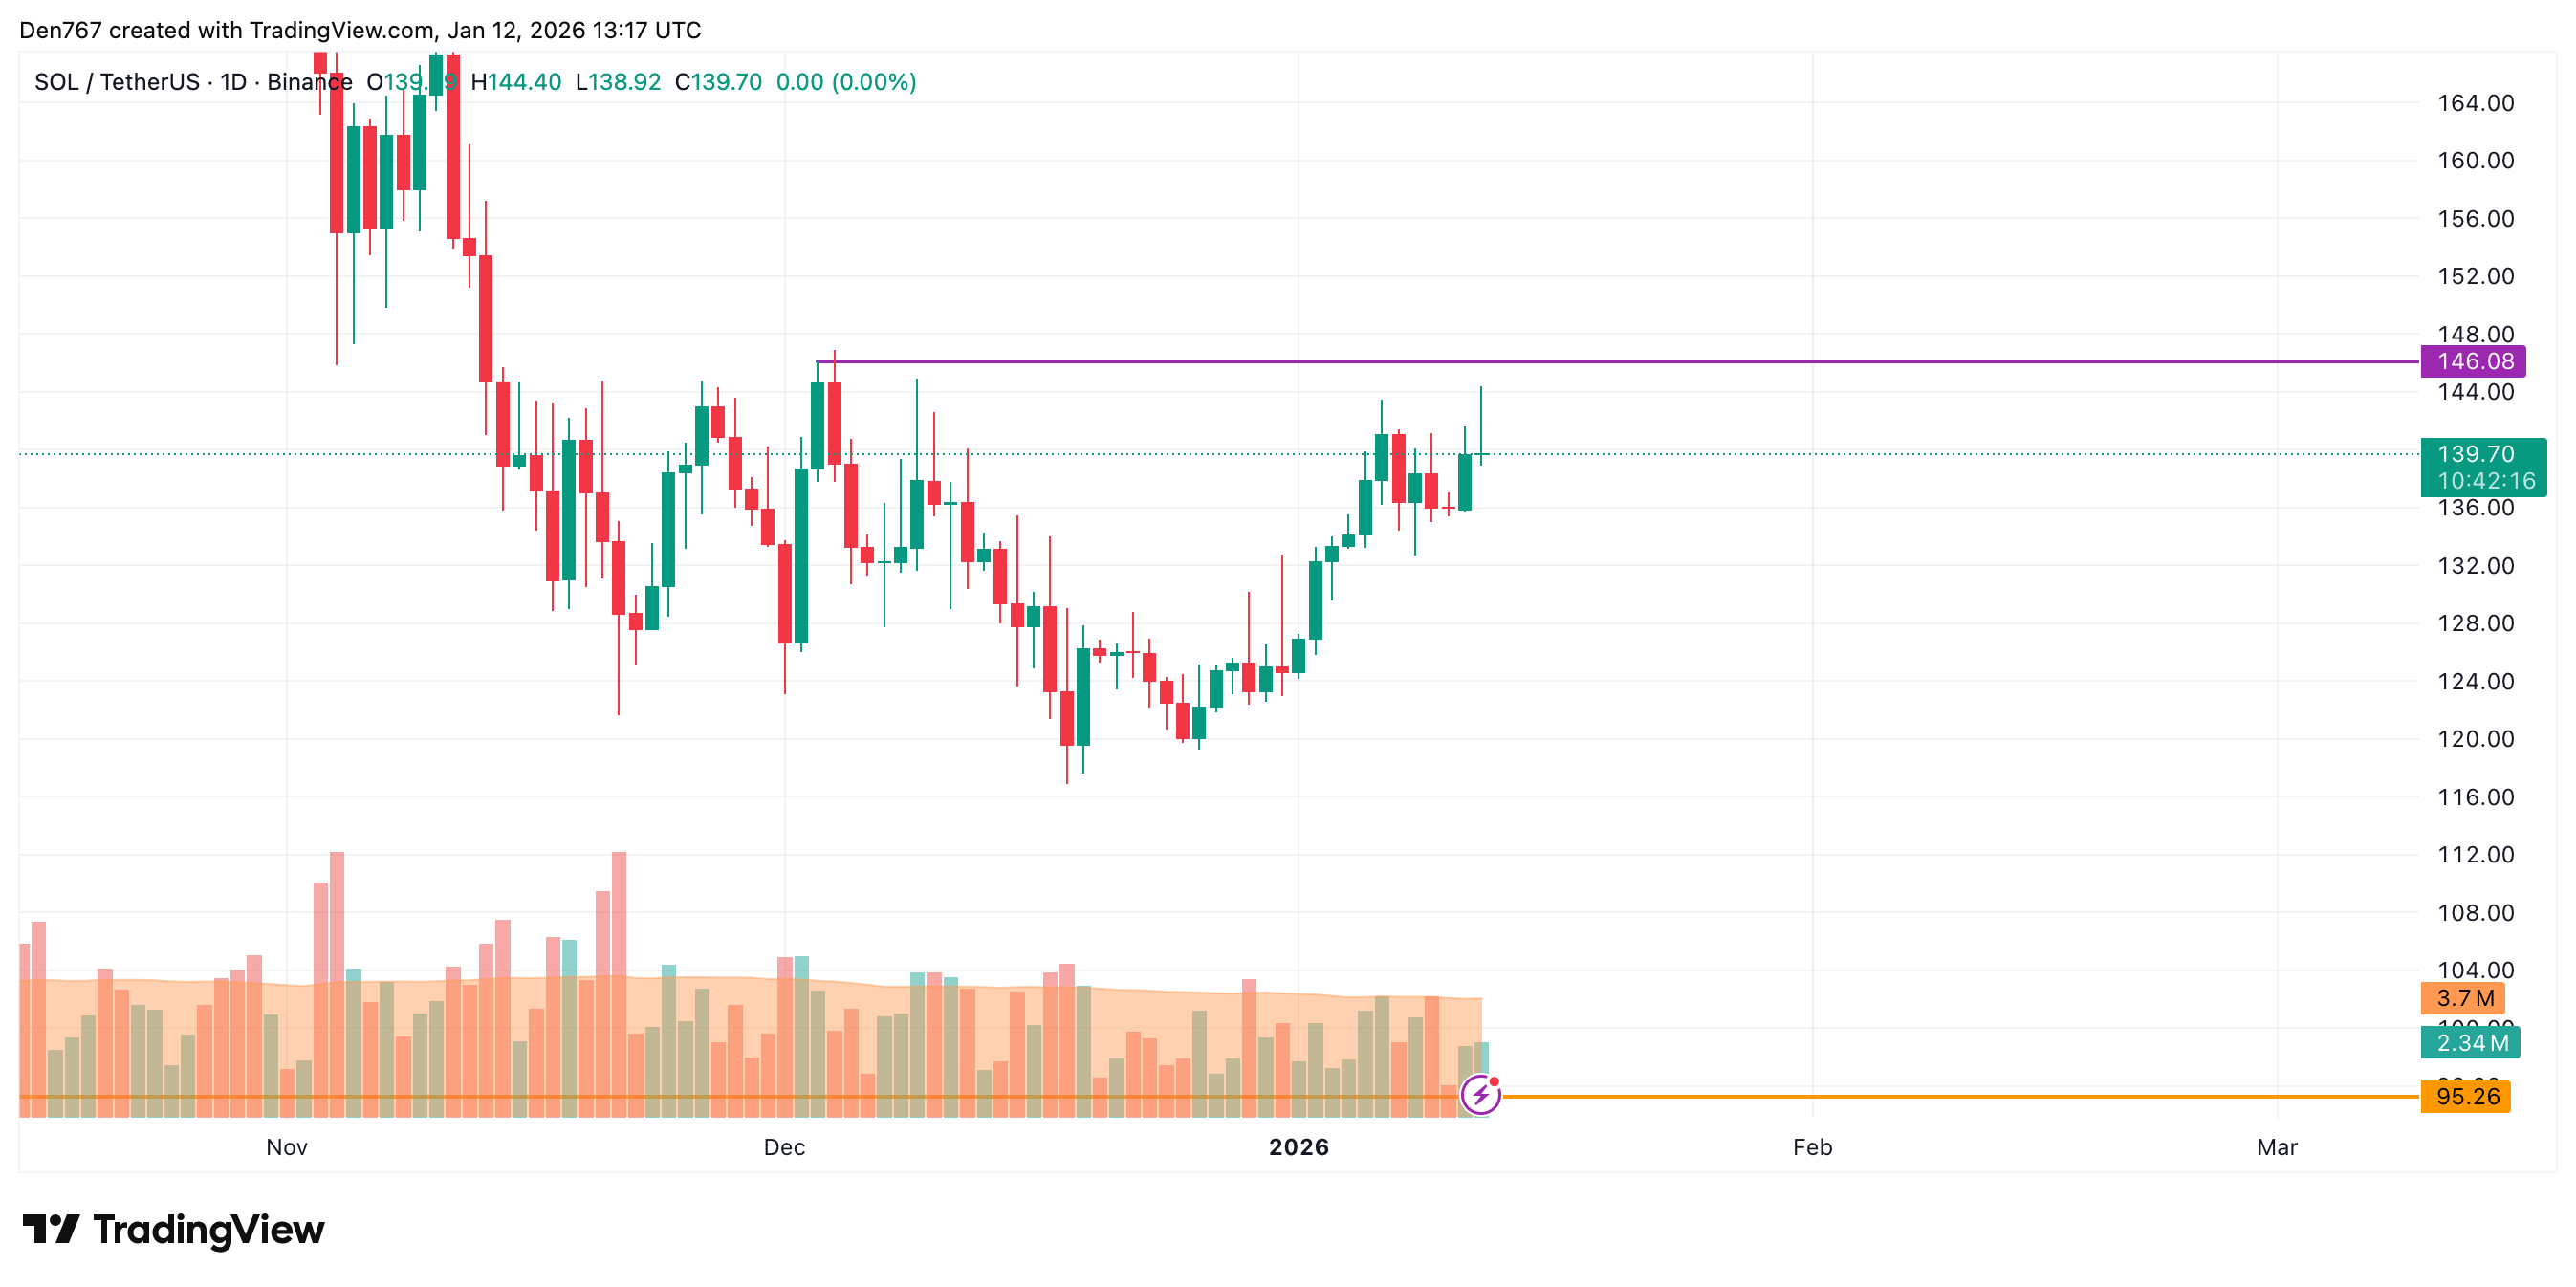
On the longer time frame, the situation is also bearish. If the daily candle closes around the current prices and with a long wick, traders may witness a test of the $130-$135 range by the end of the week.
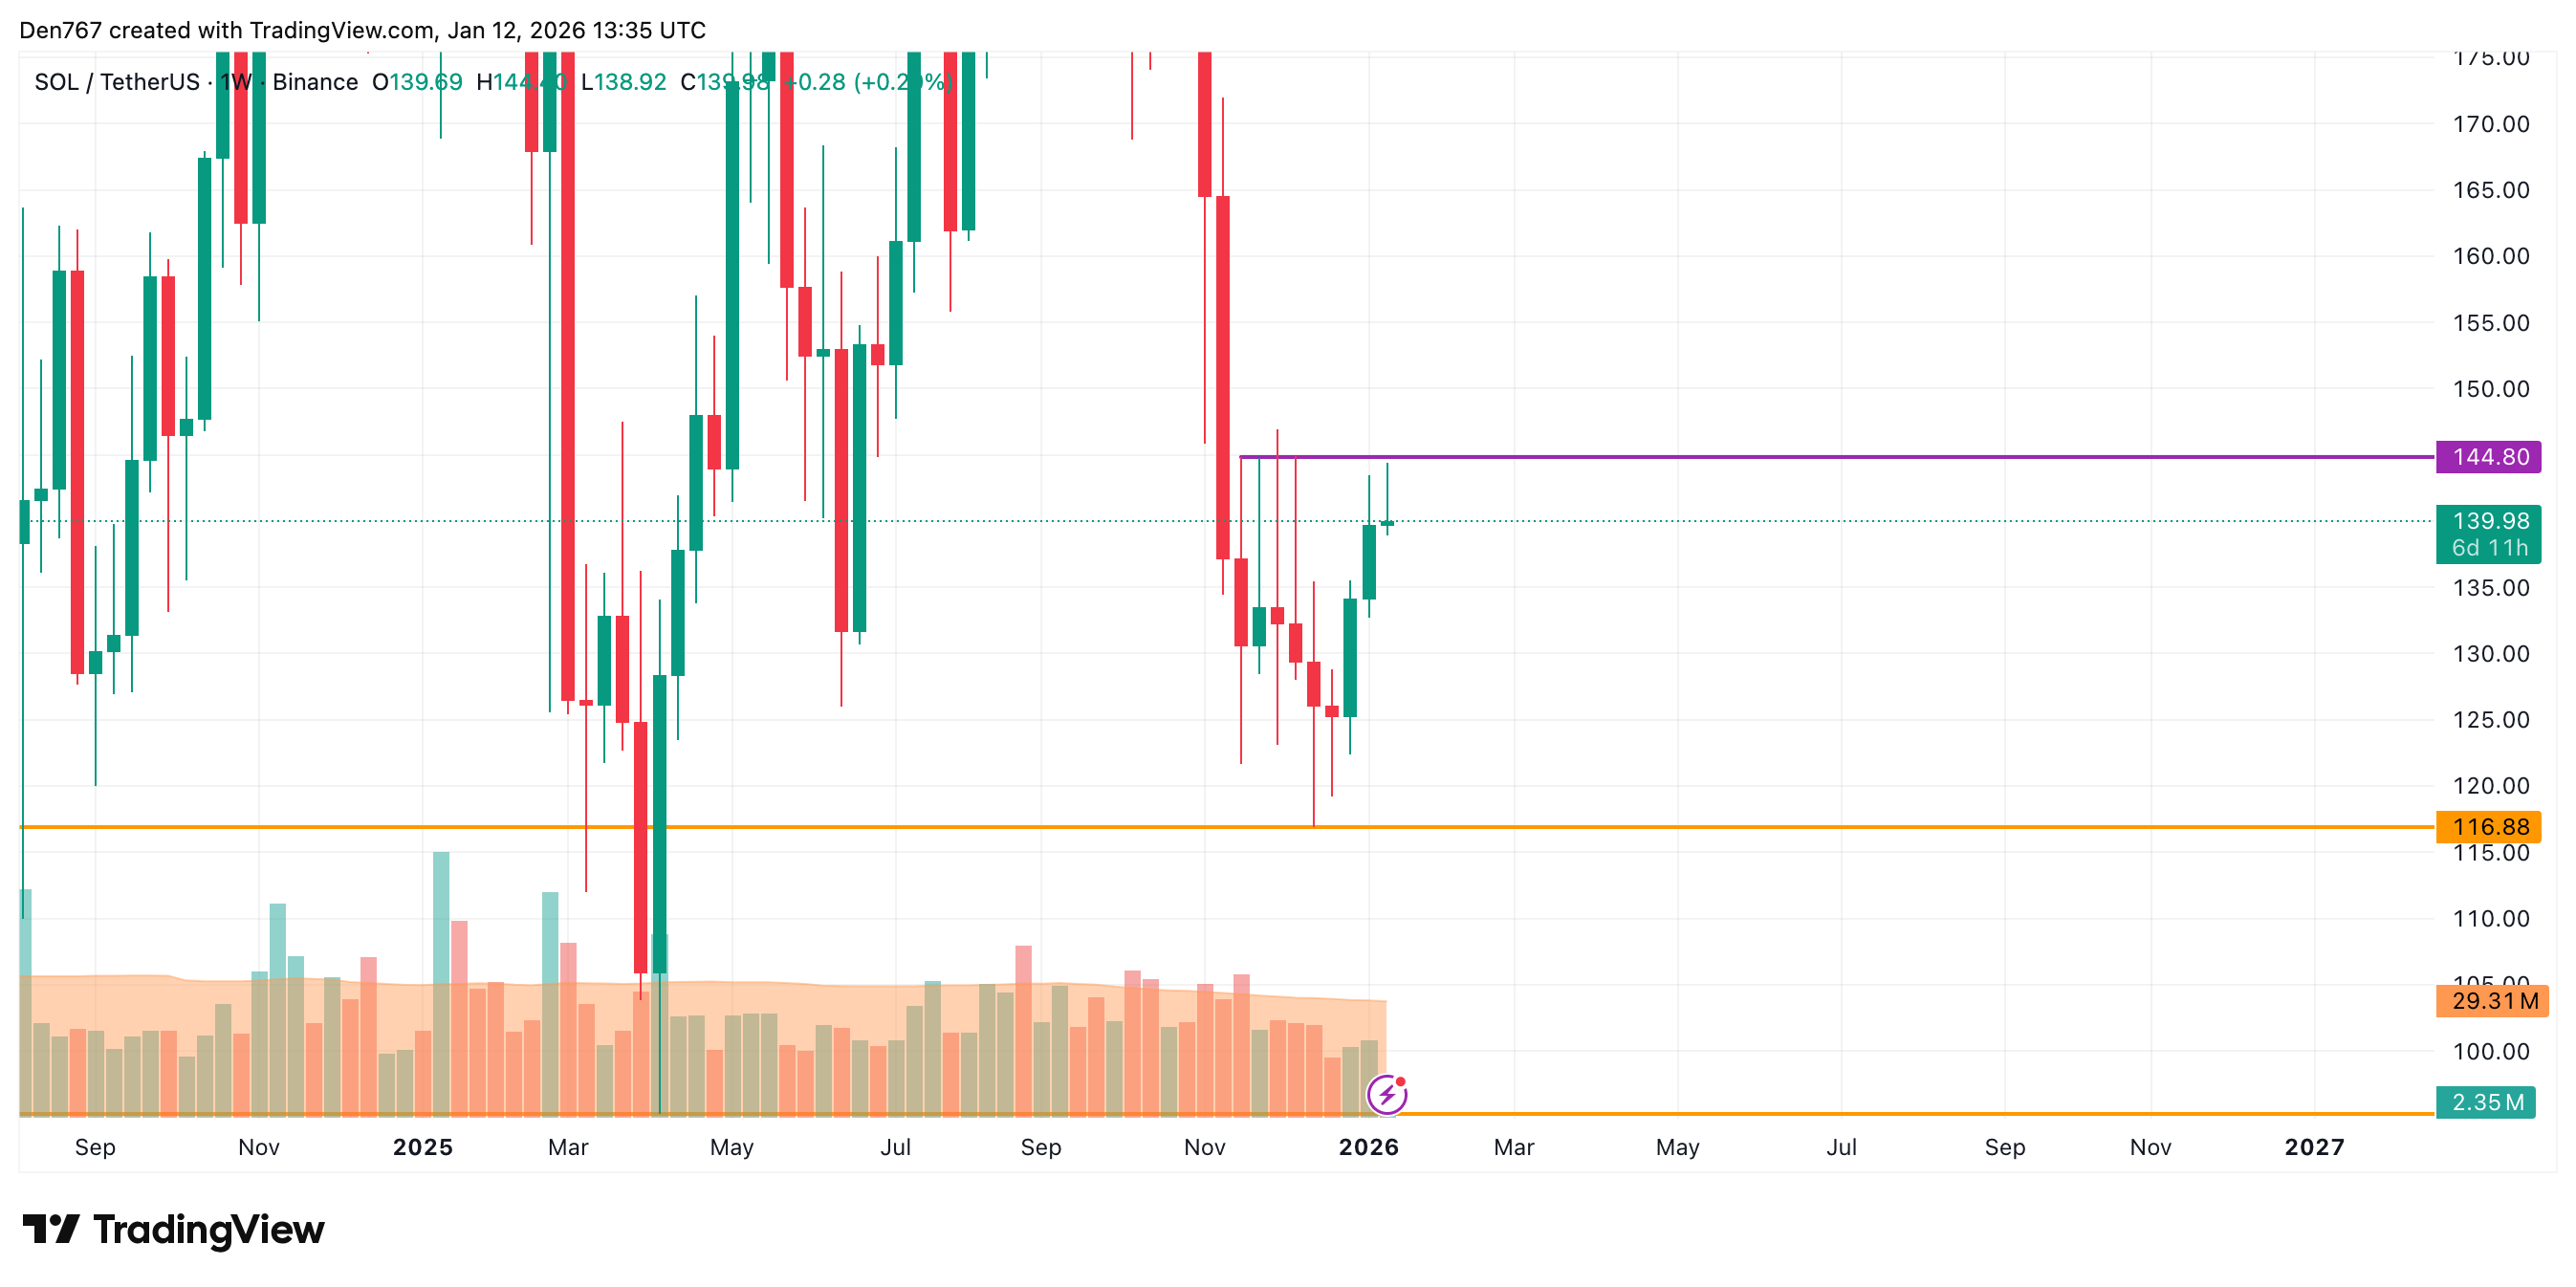
From the midterm point of view, it is too early to make such long-term predictions. One should focus on the candle's closure in terms of the nearest level at $144.80.
If the bar closes above it, the accumulated energy might be enough for a test of the $150-$160 range until the end of the month.
SOL is trading at $139.98 at press time.
