
XRP flirted with the $2.00 mark on Dec. 21, 2025, but it’s not quite ready to make that leap. Trading at $1.91, the digital asset showcased a tepid bounce after weeks of lower highs and creeping lows. With oscillators sighing “neutral” and moving averages sending side-eyes, XRP’s short-term fate hinges on reclaiming key resistance levels—emphasis on “if.”
XRP Chart Outlook
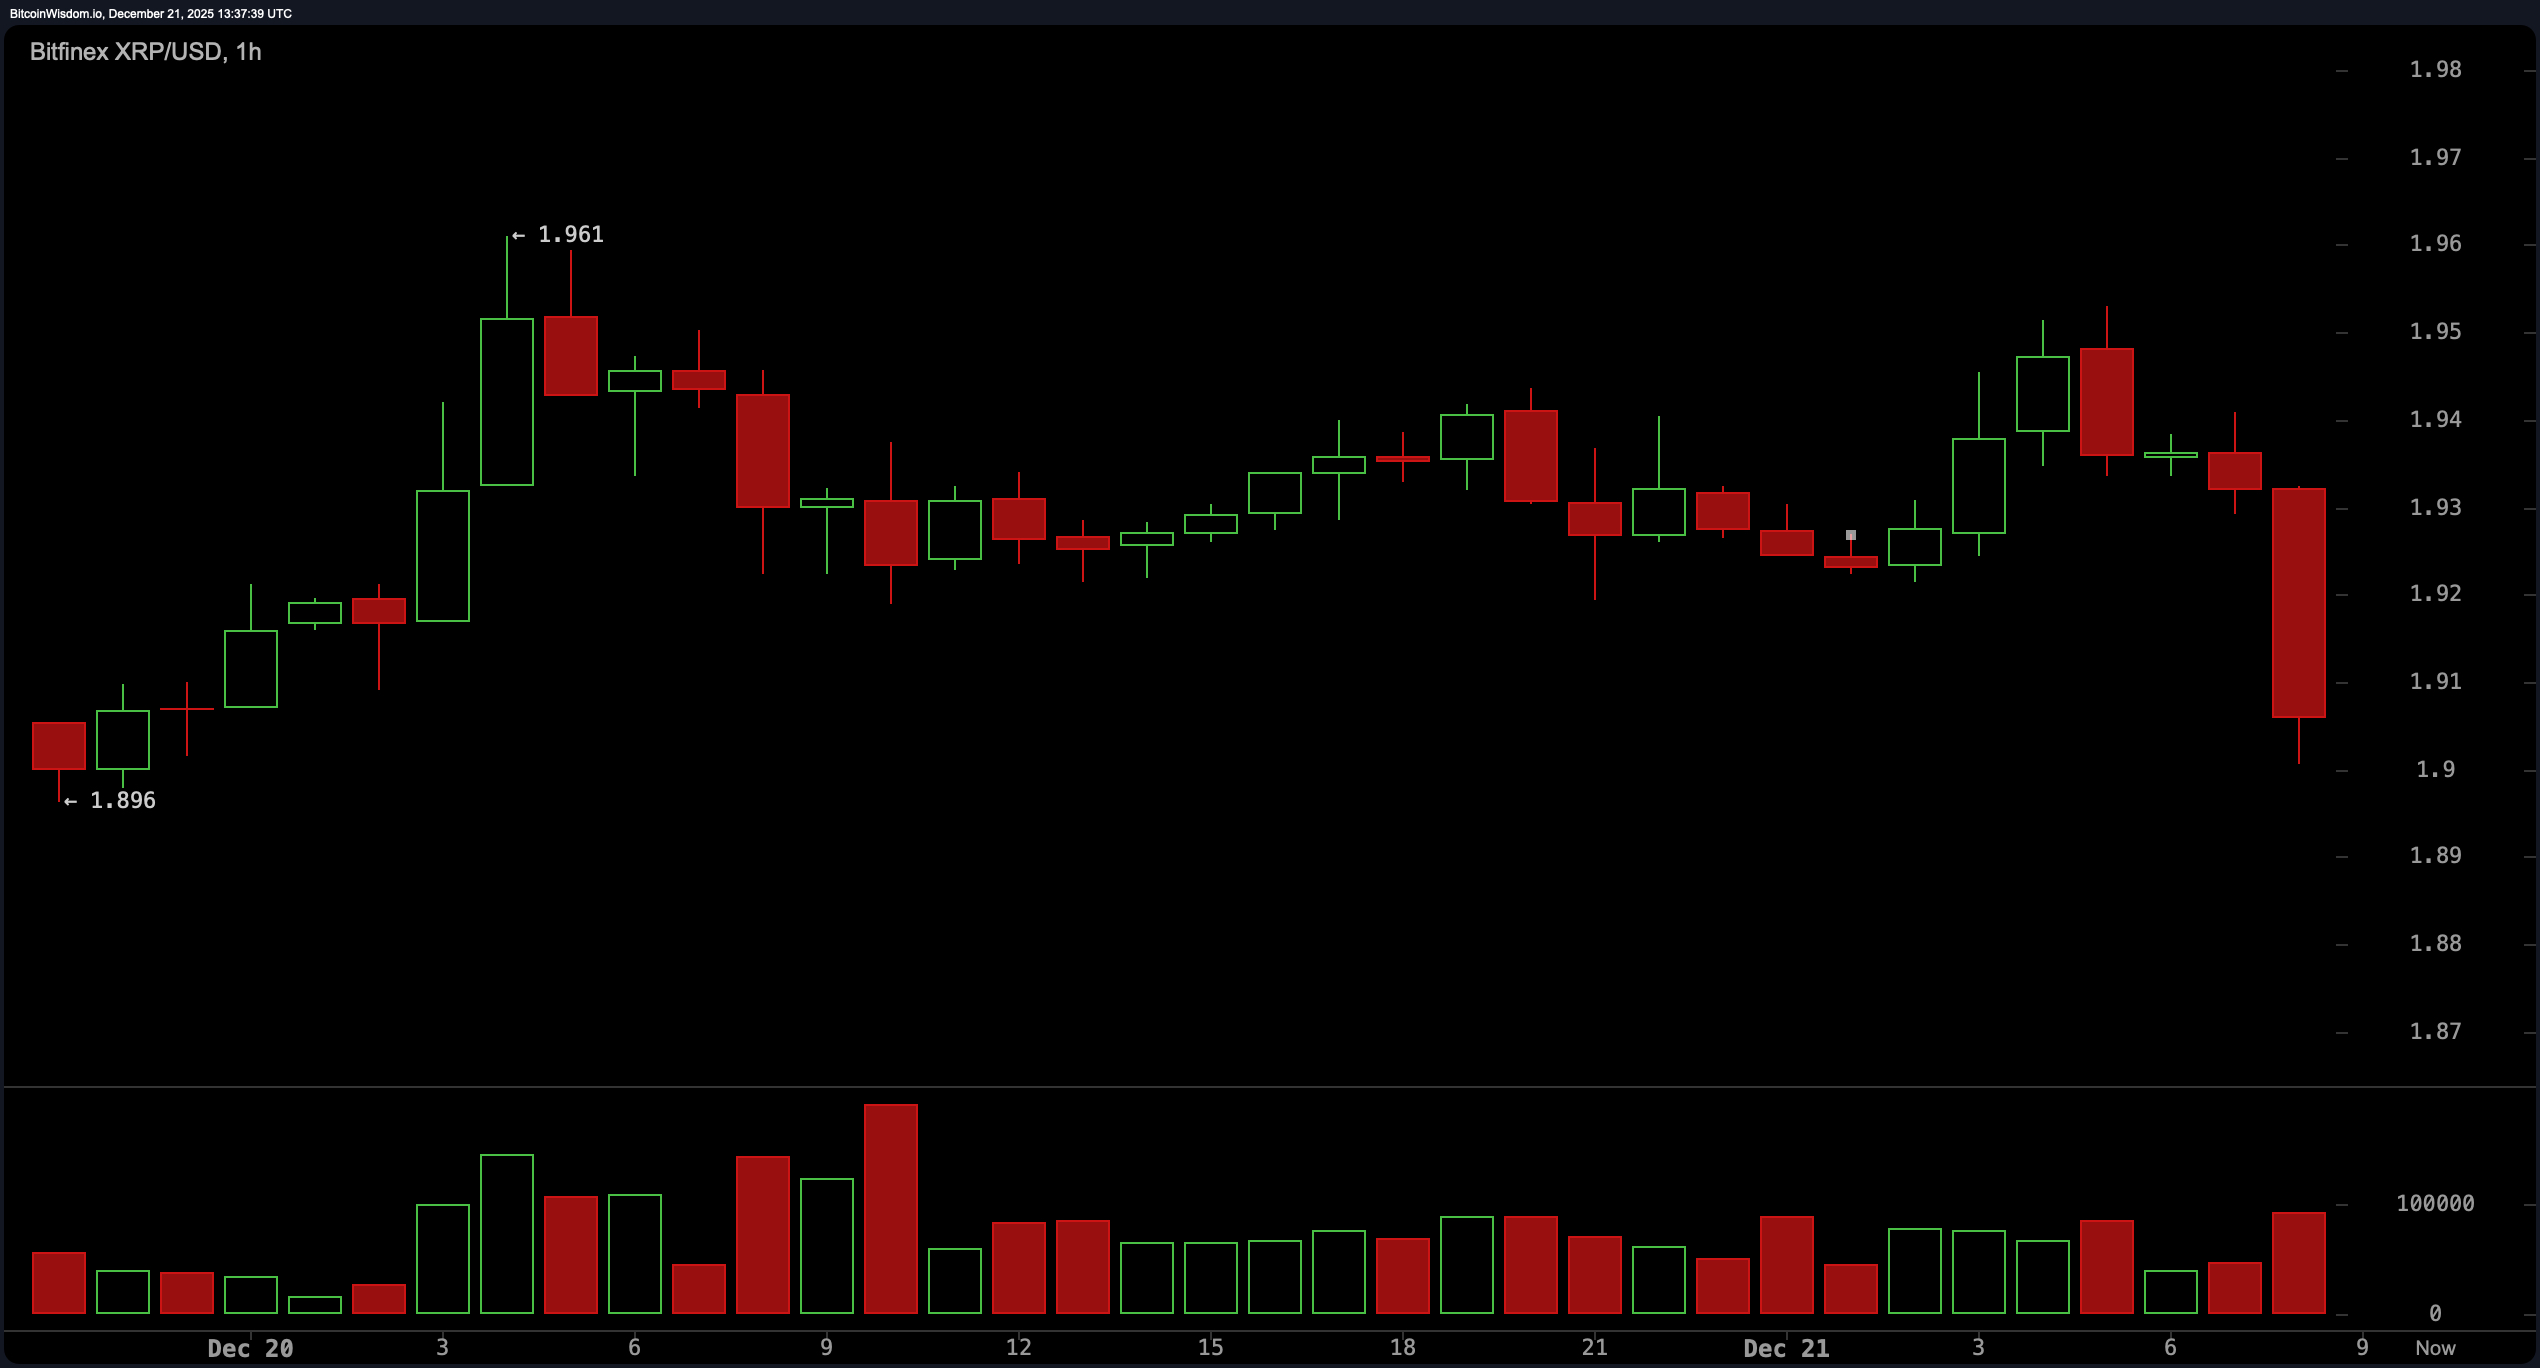
The 1-hour chart reveals XRP stuck in a tight range between $1.89 and $1.96. A brief rejection from the $1.94 to $1.96 zone led to a large red candle, hinting that bulls got a bit too eager. Market participants responded with a swift pullback, potentially catching short-term traders off guard.
This kind of “bull trap” behavior underscores the need for caution unless we see a clear candle close above $1.96. Momentum indicators like the momentum oscillator (-0.13290) and moving average convergence divergence ( MACD, -0.07719) lean toward bearish territory, casting doubt on immediate upside movement.
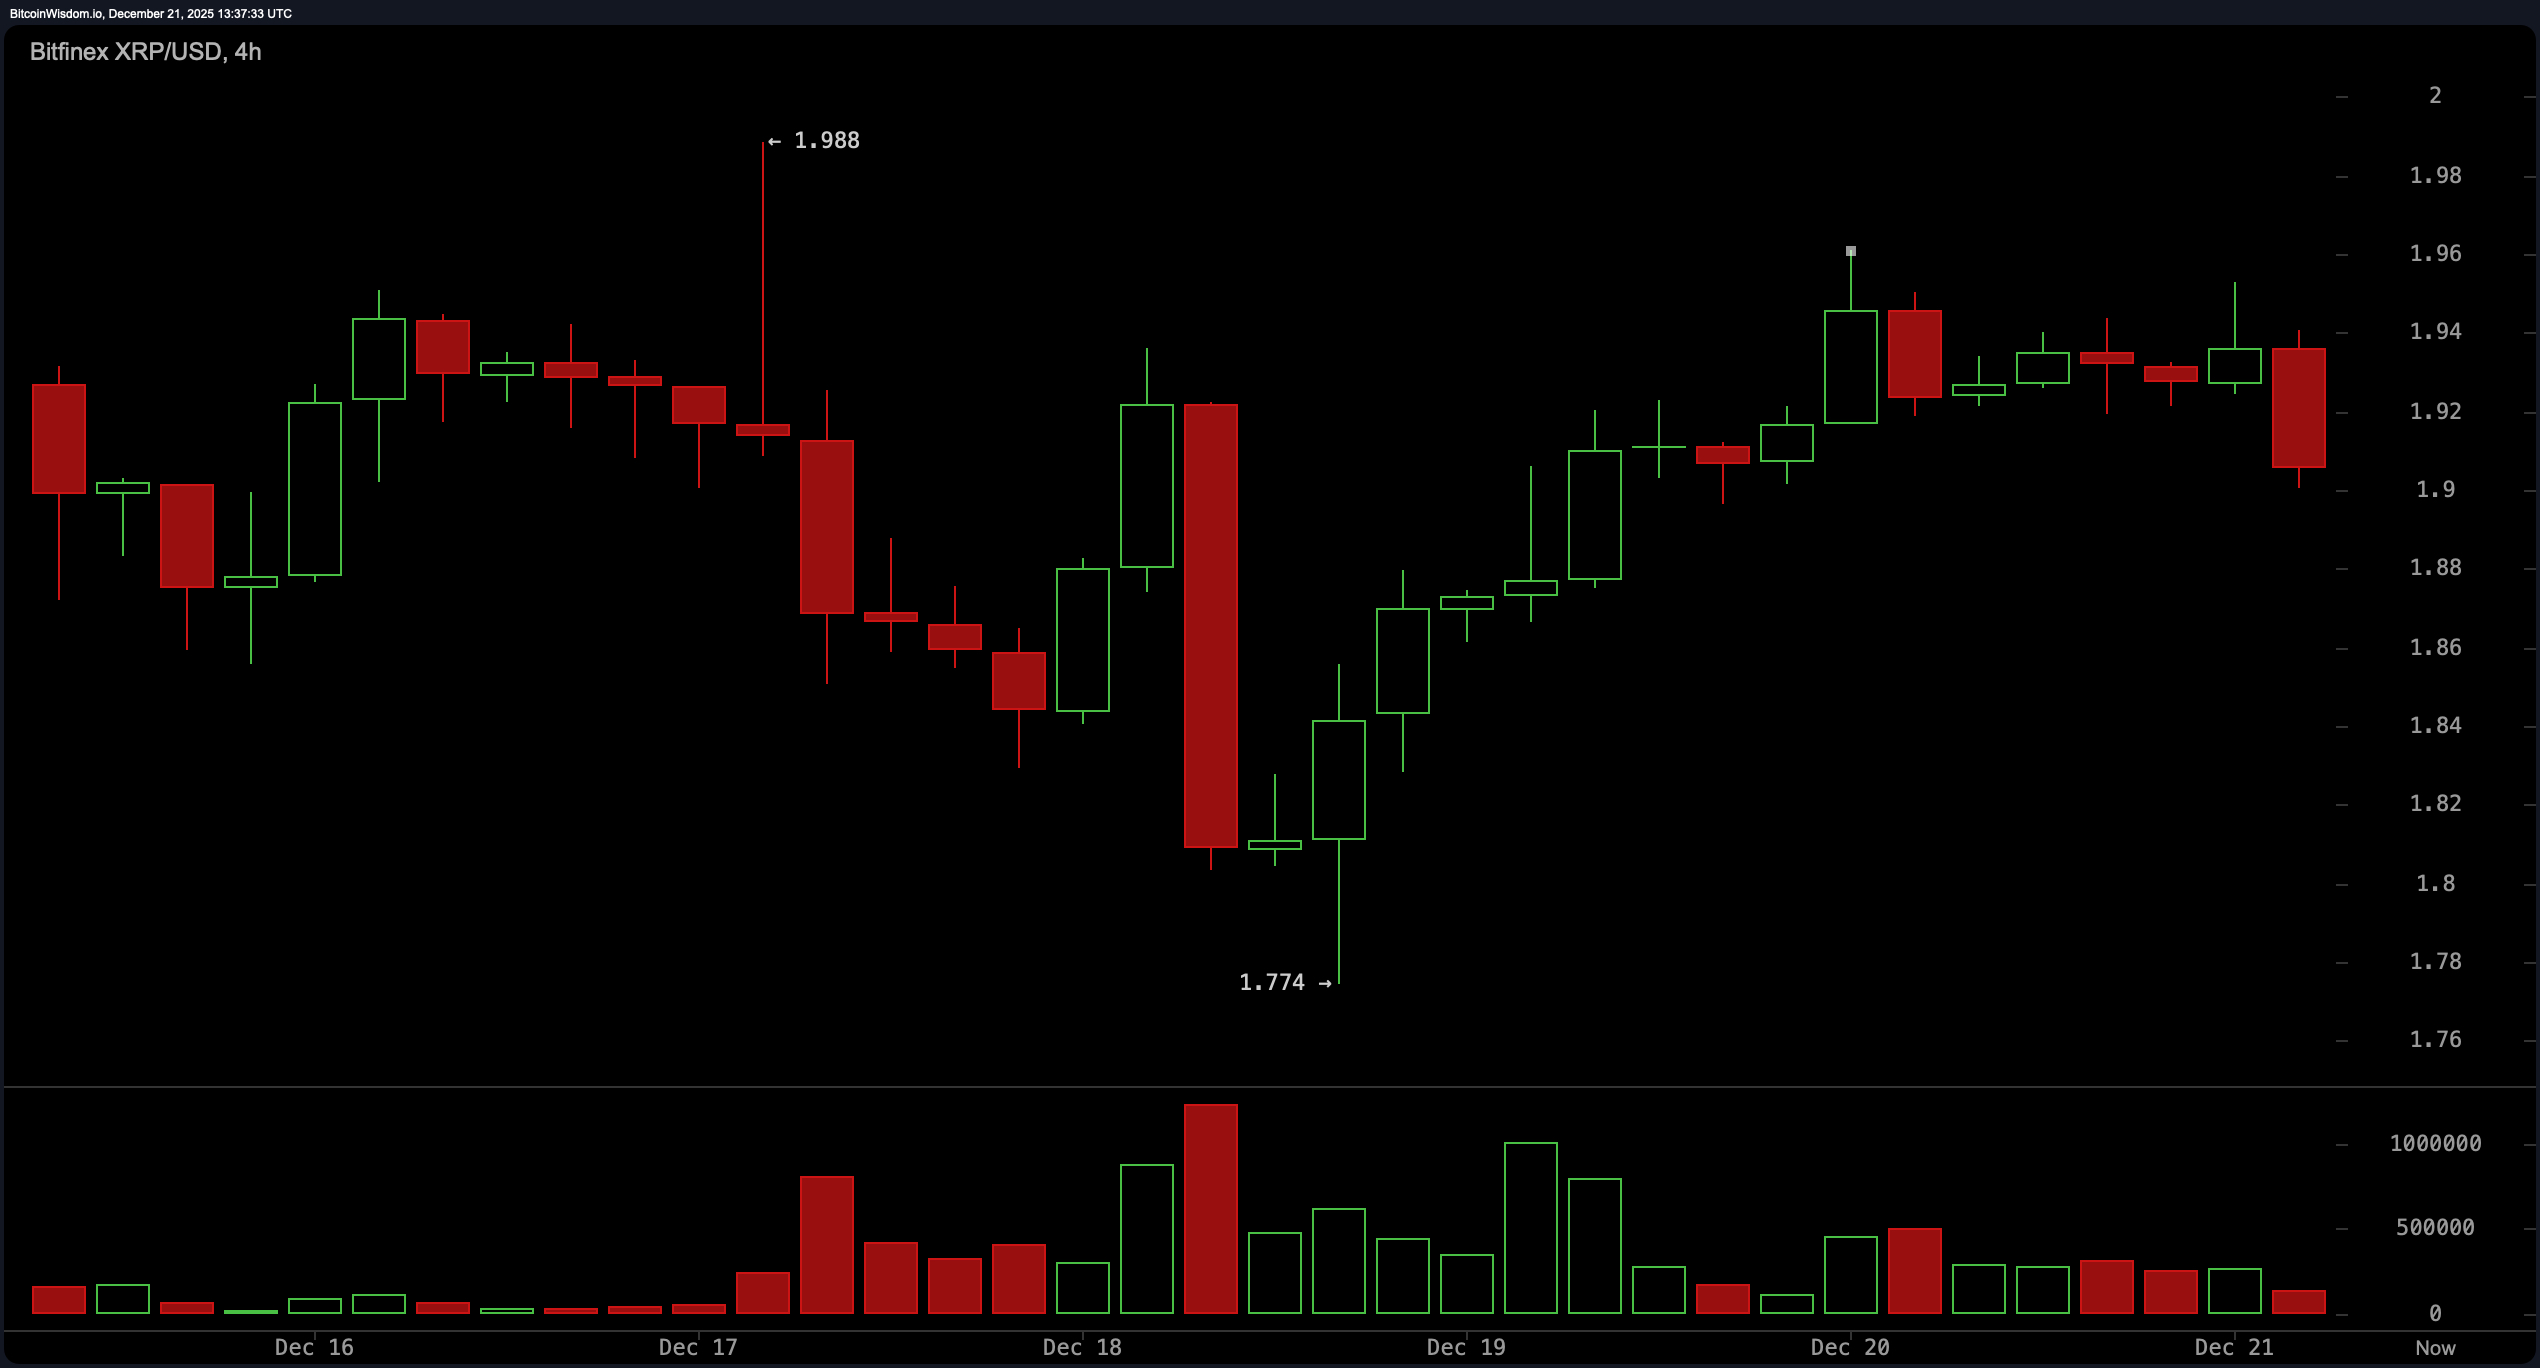
Zooming out to the 4-hour chart, things look slightly less grim. The price bounced hard from $1.774 to approximately $1.96, backed by a significant volume surge—classic signs of a liquidity sweep followed by a recovery. If XRP can defend the $1.88–$1.90 zone, which acted as prior support, it might establish a higher low and hint at a short-term bullish structure. Still, resistance at $1.96 looms like a skeptical gatekeeper. The volume’s endorsement of this rebound is promising, but without follow-through, it’s just noise.
The daily chart doesn’t mince words— XRP is still in a downtrend. The asset has been sliding from highs of $2.31 down to $1.77, with a feeble bounce from the latter failing to break through resistance at $2.00–$2.05. While the long lower wicks and green candles after the bottom suggest buyers are lurking, they’re not exactly charging in. Indicators, including the relative strength index ( RSI) at 40.73, the Stochastic oscillator at 35.31, and the average directional index (ADX) at 22.89, all fall squarely into neutral territory. It’s the kind of technical ambivalence that makes day traders reach for coffee and patience.
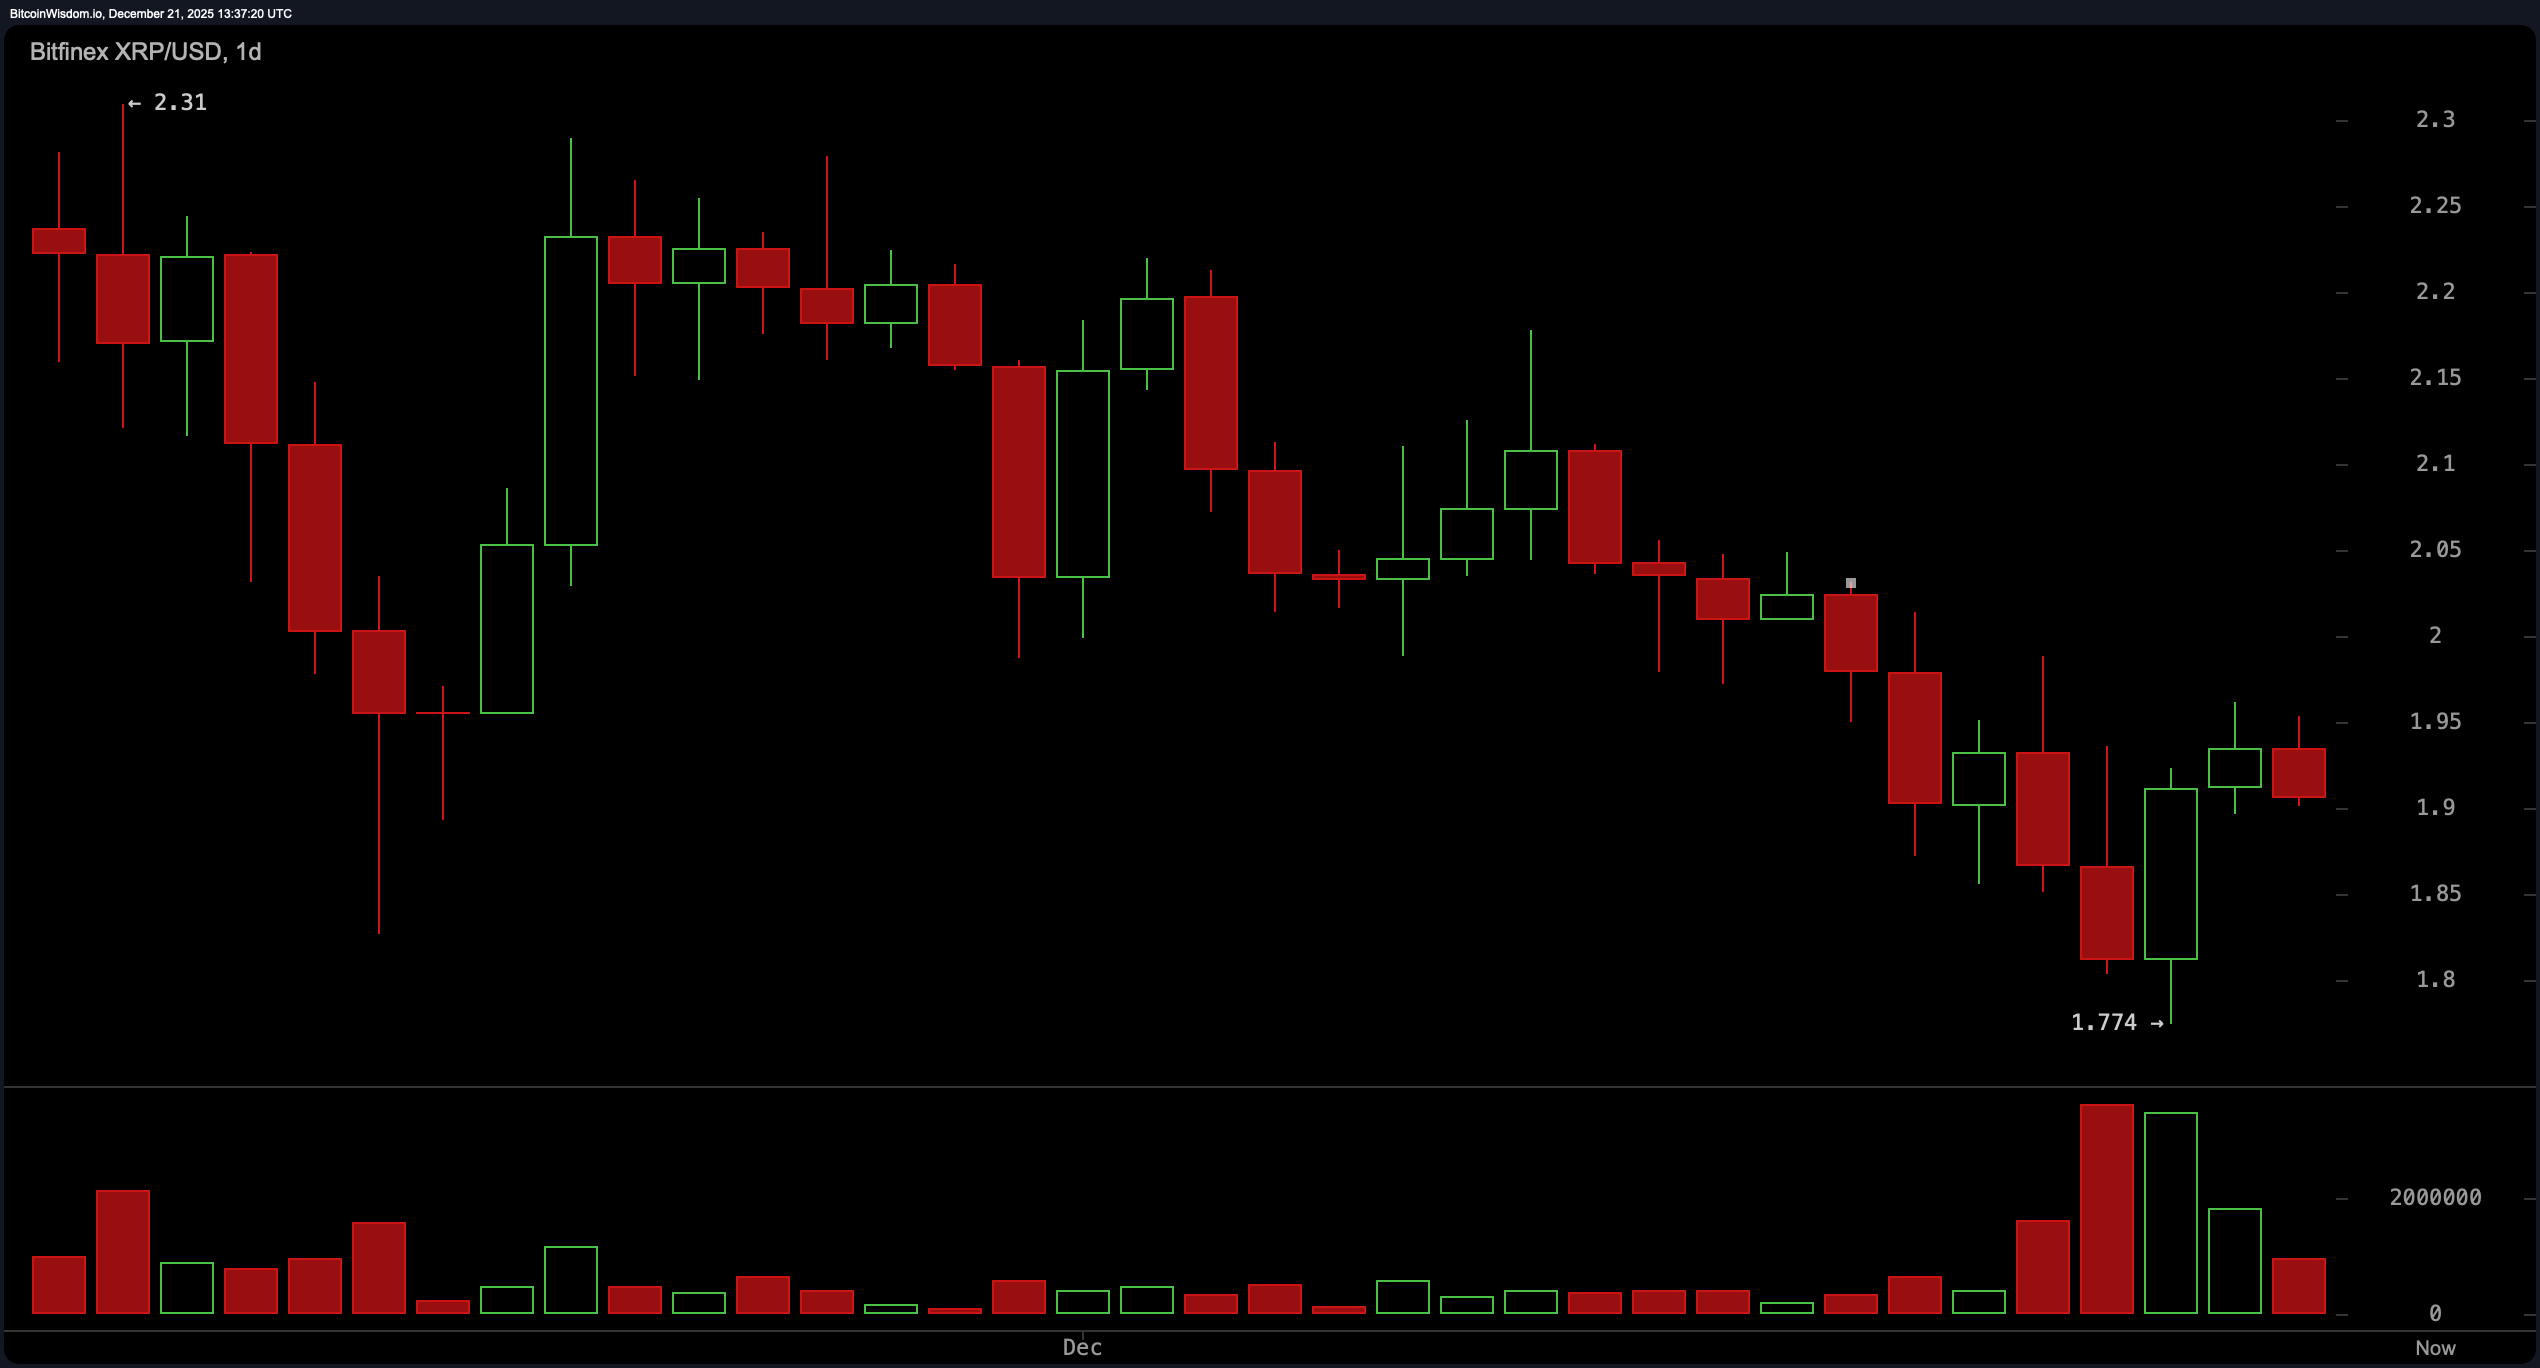
On the moving average front, XRP doesn’t get much love. Every single key moving average is waving a red flag. The exponential moving average (EMA) and simple moving average (SMA) across 10, 20, 30, 50, 100, and 200 periods are all flashing bearish indicators, with the 200-period simple moving average at $2.58747 towering above the current price. These figures suggest the longer-term trend remains downhill, and any rallies may simply be corrective rather than foundational.
In summary, XRP is dancing on a tightrope between recovery and relapse. While short-term timeframes hint at rebounds and potential structure formation, the daily chart and moving averages tell a different story—one of caution, resistance, and unresolved directional bias. Technicals suggest XRP has more proving to do before it shakes off the funk and dares to reclaim the $2.00 throne. Until then, traders may want to keep their seatbelts fastened and their fingers close to the volume dial.
Bull Verdict:
If XRP can establish a convincing close above $1.96 and reclaim the $2.00 level on strong volume, the stage is set for a potential rally. A higher low on the 4-hour chart, backed by renewed momentum, could usher in a short-term recovery with targets at $2.15 to $2.25. For bulls, the key lies in flipping resistance zones into support and ignoring the side-eye from those stubborn moving averages.
Bear Verdict:
With every major moving average signaling downside and momentum indicators still leaning negative, XRP’s bounce might be little more than a dead-cat spring. Failure to hold $1.88 could drag the price back to test $1.77—or lower—continuing the broader downtrend. Unless bulls can force a breakout through the $2.00 resistance, the bears retain the upper hand, with gravity as their faithful accomplice.
FAQ 📉
- What is the current price of XRP on December 21, 2025? XRP is trading at $1.91 with a recent intraday range of $1.91 to $1.95.
- Is XRP showing bullish or bearish technical signals?Technical indicators and moving averages lean bearish, despite short-term rebounds.
- What are the key support and resistance levels for XRP now?Support sits around $1.77 to $1.80, with resistance at $2.00 to $2.05.
- What would confirm a breakout for XRP?A 1-hour candle close above $1.96 on strong volume would suggest bullish momentum.