
Shiba Inu is lower on the day, trading below a falling SMMA as momentum stays negative, while futures data shows net outflows. Where is SHIB headed?
In the past 24 hours, SHIB has dropped about 4.1%, changing hands around $0.000007812 after moving within a daily range of $0.000007754 to $0.000008215. That range suggests sellers attempted a push higher, but selling pressure forced prices back down, with bids appearing closer to the day’s lower end.
The move is happening with noticeable market participation, as SHIB sits near $131.67M in 24-hour trading volume. With SHIB also down about 9% over the past week, the next question is whether this drop is setting up a base, or if another wave of selling is still ahead.
Shiba Inu Price Prediction
Looking deeper into the hourly chart, SHIB remains below the 7-period smoothed moving average (SMMA), which sits near $0.00000784. The moving average is sloping downward and has been acting like dynamic resistance. Rebounds are still being capped until the price can close back above that level and hold.
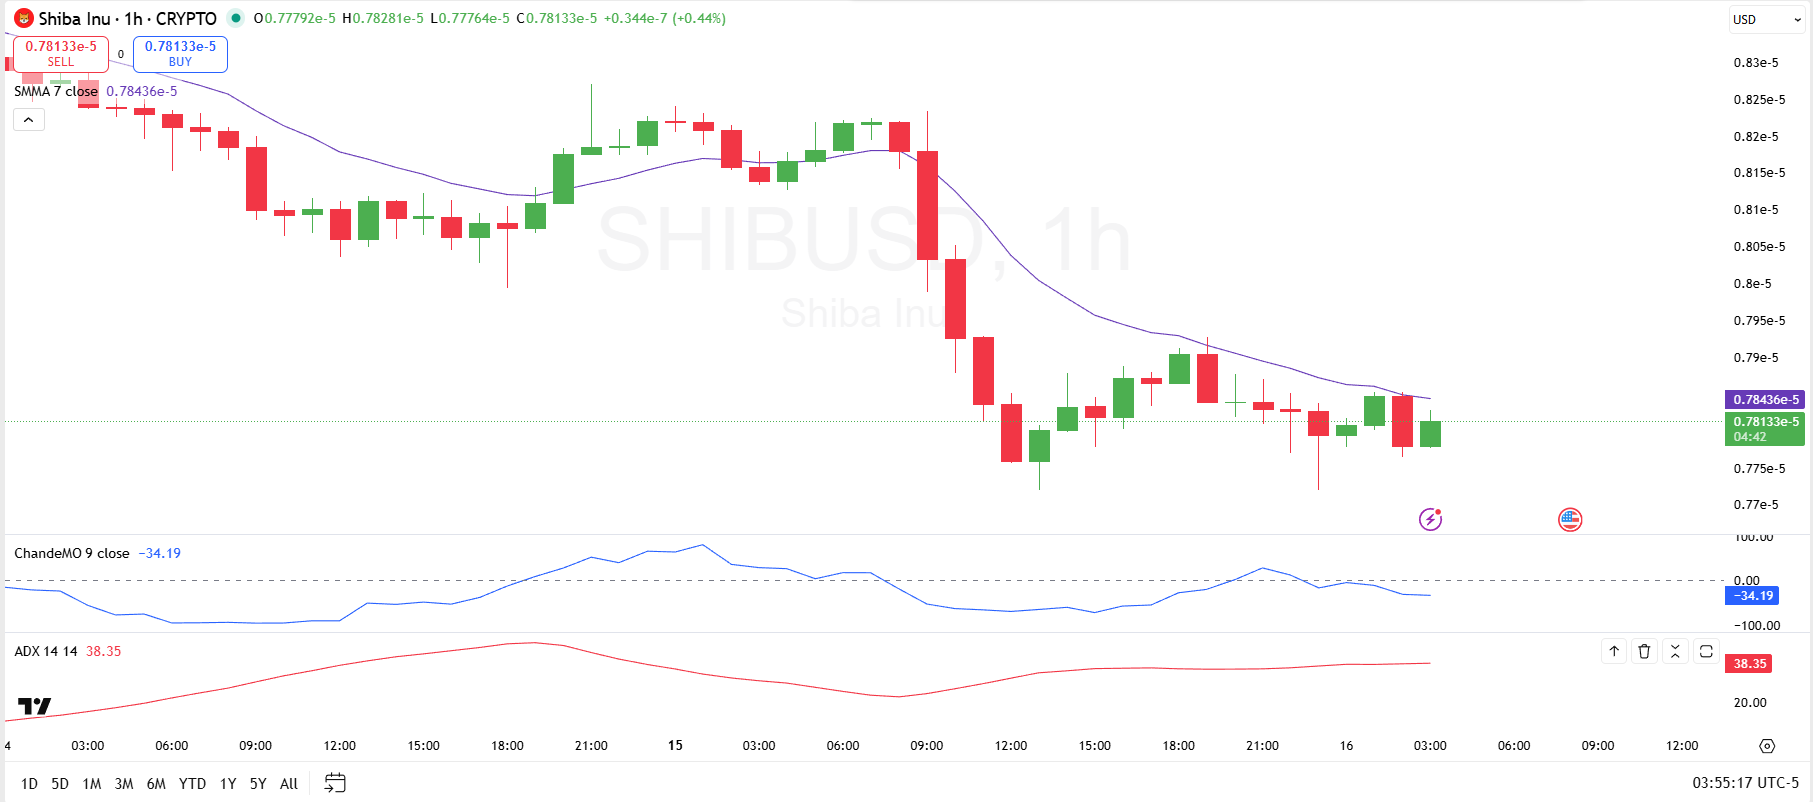
Momentum is still tilted bearish, with the Chande Momentum Oscillator near -34. That reading suggests sellers still have the edge, even though the recent movement shows some stabilization. A more constructive shift would be the oscillator rising above 0, which would signal that selling pressure is fading and buyers are starting to regain control.
Trend strength remains elevated, with ADX (14) around 38. ADX doesn’t tell direction by itself, but readings above 25 typically imply a strong trend. With SHIB still under a falling SMMA and momentum negative, the ADX level supports the idea that the broader move still carries strong downside pressure, even if the market is pausing.
For key levels, SHIB has a potential floor around $0.00000775–$0.00000780. If those levels fail, sellers may try to push toward $0.00000770. On the upside, resistance starts at $0.00000784 (the SMMA), then extends toward the recent reaction zone around $0.00000790–$0.00000793.
Shiba Inu Outflows Persist
Elsewhere, SHIB’s futures flows are sending a clear signal that traders remain cautious, with net outflows persisting across the latest time windows. Over the 12-hour timeframe, SHIB futures flows show $4.86M in inflows versus $5.10M in outflows, leaving a net outflow of about $235.8K.
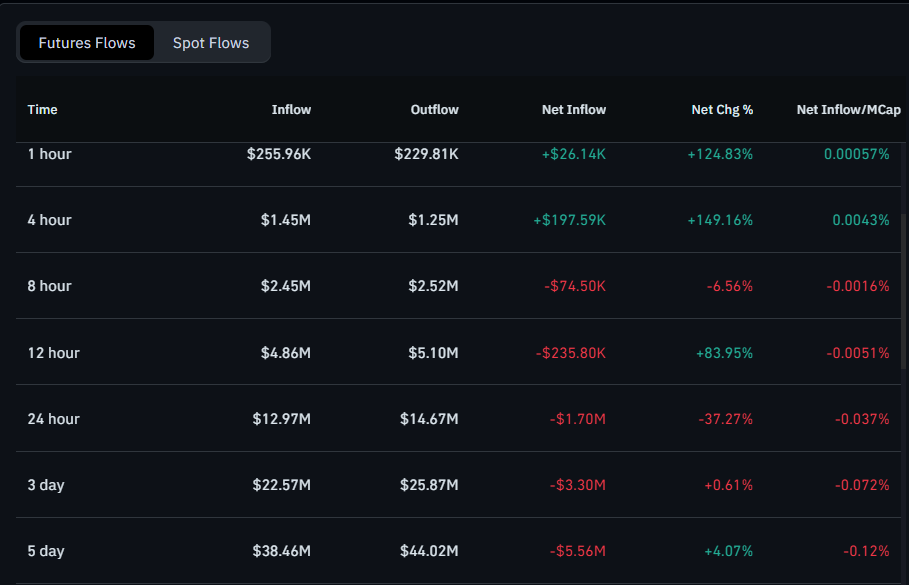
Even though the net change metric is positive at 83.95%, the net figure is still negative, which suggests the latest period may be less bearish than before but has not flipped into net demand. Net inflow relative to market cap is also slightly negative at 0.0051%.
Over the 24-hour period, the imbalance is clearer: $12.97M flowed in while $14.67M flowed out, producing a net outflow of about $1.70M. The net change shows a negative figure at 37.27%, and net inflow/market cap drops to 0.037%, pointing to heavier net withdrawals and weaker positioning compared with the shorter window.
Zooming out to 3 days, the pattern remains consistent. Inflows total $22.57M against $25.87M outflows, resulting in a net outflow of roughly $3.30M. Even though the net change is positive at only 0.61% (near-flat), the cumulative net flow staying negative across 12 hours, 24 hours, and 3 days suggests traders have broadly been reducing exposure rather than adding, unless these net figures start shrinking meaningfully or turn positive.