
Binance’s native coin, BNB, has overtaken Ripple’s XRP and is now the fourth-largest cryptocurrency by market cap.
With a market cap of $118 billion, BNB is now ahead of XRP’s $113 billion.
However, the flip comes as BNB, XRP, Bitcoin, and other leading cryptocurrencies underperform.
BNB briefly dropped below the $850 mark on Monday as it lost 3.5% of its value in the last 24 hours.
It has now slightly bounced back and is trading above $860 per coin. The bearish sentiment could see BNB record further losses in the near term, with its on-chain and derivatives data showing rising retail activity.
However, the retail activity shows increasing sell-side dominance, and funding rates are turning negative.
The technical indicators also indicate further selling pressure on the horizon.
Negative funding rates could see BNB dip lower
Copy link to section
According to CryptoQuant’s Futures Market summary data, the Futures Average Order Size indicator has risen, signaling increased retail activity in the market, suggesting that BNB’s price could dip lower in the near term.
This indicator tracks the average size of executed BNB futures trades. In addition to that, the Futures Taker CVD (Cumulative Volume Delta) for BNB indicates a sell-dominant phase, adding more confluence to the bearish narrative.
Furthermore, CoinGlass’s OI-Weighted Funding Rate data reveals that the number of traders betting on BNB’s price slipping exceeds those anticipating a price surge.
This metric switched negative on Monday and currently reads -0.006%, indicating that shorts currently outweigh the longs. Usually, when funding rates flip negative, the price of an asset drops lower.
BNB shows further signs of weakness
Copy link to section
The BNB/USD 4-hour chart is bearish and efficient as the coin has lost 3.5% of its value since the start of the week. The bearish performance comes after BNB faced a rejection around the $897 resistance level on Sunday.
It briefly dropped to the $844 daily support on Monday but has now bounced back and is trading at $860 per coin.
If the bearish trend continues and BNB closes its daily candle below the $844 support, the coin could extend its decline towards the next major weekly support level at $709.
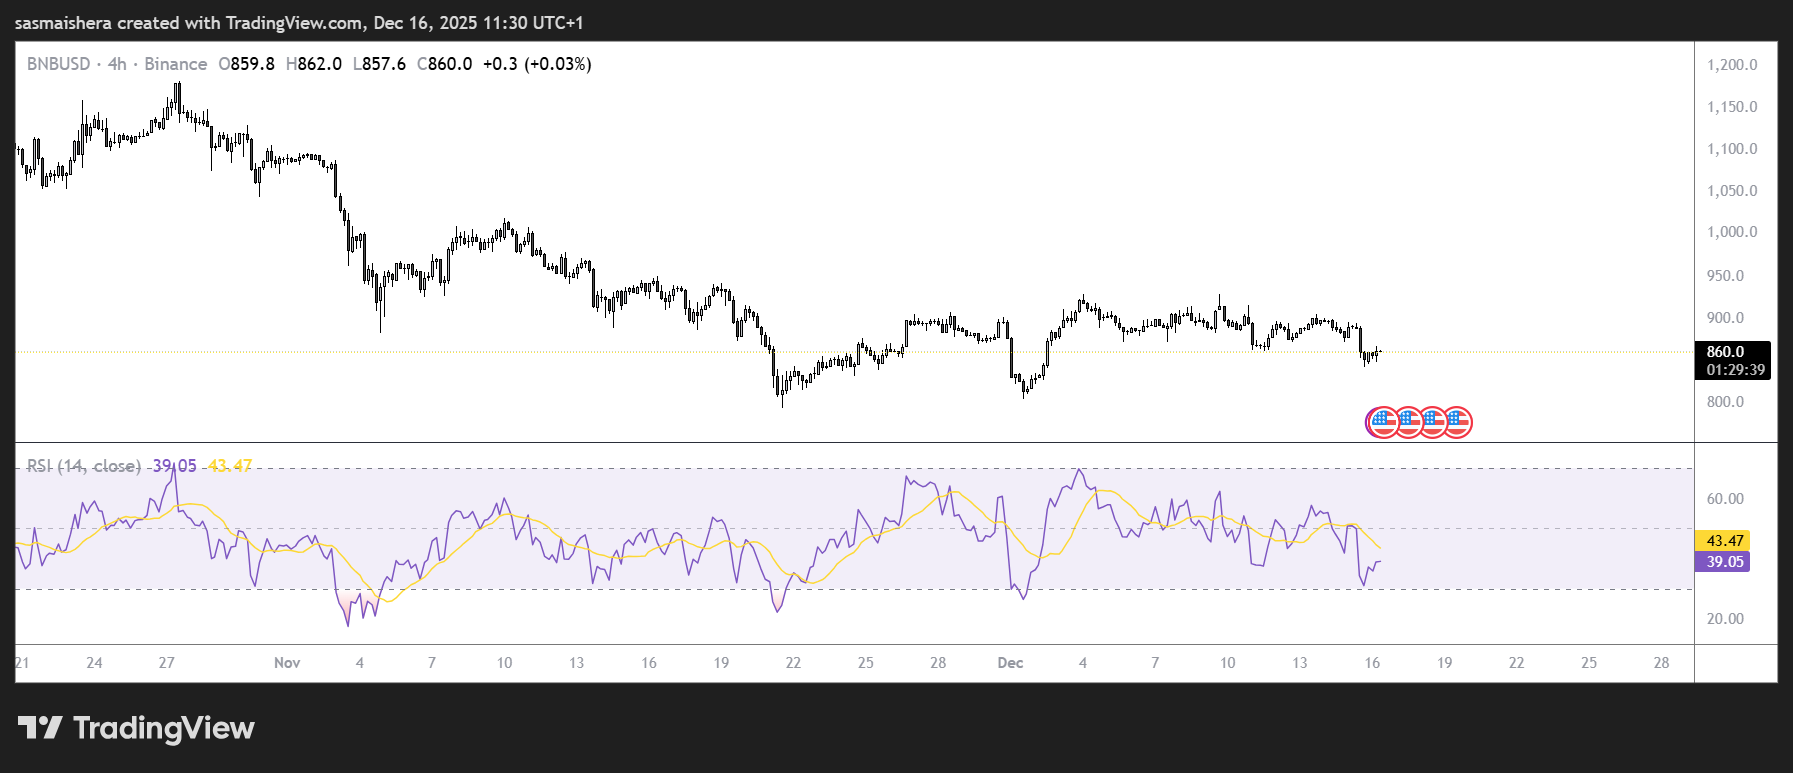
Currently, the momentum indicators are bearish and could get weaker in the near term. The Relative Strength Index (RSI) on the 4-hour reads 42, below its neutral level of 50 and pointing downward, indicating bearish momentum is increasing.
The Moving Average Convergence Divergence (MACD) lines have converged, flipping into a bearish crossover, and flashing a sell signal to traders.
If the bulls regain control of the market, BNB could recover its recent losses and rally towards the 50-day Exponential Moving Average (EMA) at $923.14. The Transactional Liquidity (TLQ) at $1,017 could serve as another resistance level in the near term.