
Dogecoin is testing key support levels with potential for a rebound, as an analyst predicts a surge to a 2-month high.
Currently changing hands for $0.1402, Dogecoin has experienced a 2.4% drop over the past 24 hours, trading within a narrow range of $0.1396 to $0.1443.
Despite the short-term drop, Dogecoin’s 7-day performance shows a mild recovery of 3.3%, indicating a slight upward trend over the week. However, the 14-day performance presents a more significant 5.8% loss, which aligns with the broader market trends.
This price action over the 24-hour and 7-day period highlights the volatility and uncertain sentiment surrounding Dogecoin. Amid this performance, traders and analysts are looking at technical charts to gain further insights into the potential direction of Dogecoin’s price movement. Where is Dogecoin headed?
Dogecoin’s Weekly Price Chart
Notably, the Dogecoin weekly chart reveals a downward price trend, with key Fibonacci retracement levels acting as significant support and resistance zones.
After peaking at $0.30676, Dogecoin has retraced to lower levels, with Fibonacci 1 at $0.130 providing the next strong support zone. The price is now headed towards this support, with a bounce taking it back to test the 0.786 Fibonacci zone above $0.168.
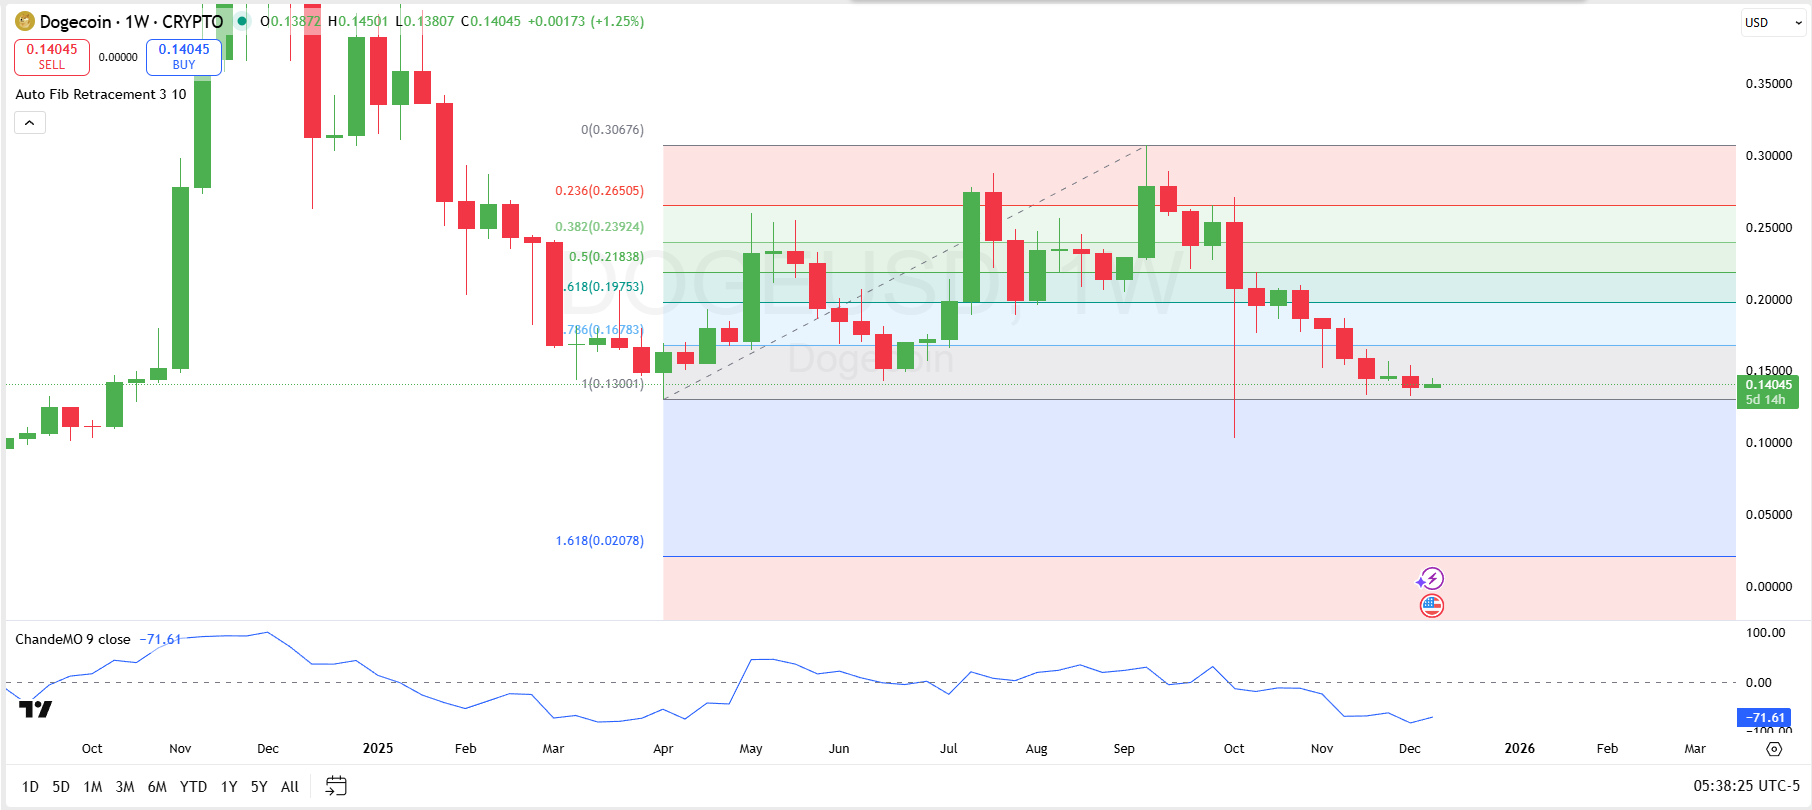
If the price fails to hold above this support, the next major level to watch is $0.0208. On the far upper side, the 0.618 Fibonacci level at $0.198 remains a significant hurdle, with the price struggling to break past it in mid-October. If Dogecoin manages to rally, this zone will be crucial to watch for potential rejection or breakout.
Meanwhile, the ChandeMO indicator is currently in the oversold zone at -71.61, indicating bearish momentum, which adds to the significance of these support and resistance levels. A sustained price movement above $0.19753 could suggest a shift toward a more neutral stance, while further bearish movement could see the price test deeper levels near $0.021.
Another Classic Rebound Incoming?
On the commentary side, analyst AltCryptoTalk highlights DOGE retesting a crucial weekly demand zone, which has historically been a catalyst for major rallies. This area, between $0.10 and $0.14, has consistently attracted buyers in the past, such as during the surge above $0.48 in late November and early December.

With Dogecoin’s price nearing this critical support level again, there is a strong possibility for another classic rebound. If this demand zone holds, the next key target could be the $0.30 resistance, presenting a potential for substantial upside in the near term. To reach $0.3 from the current price of $0.1402, Dogecoin must surge by 114%.