


 14
14
The Cardano price is at a critical juncture, with key Fibonacci levels determining potential bullish or bearish movement.
Cardano ($ADA) currently changes hands at $0.4258, showing a 2.2% decline in the last 24 hours. The 24-hour trading range for $ADA is between $0.4401 and $0.4255. Meanwhile, its market cap stands at $15.61 billion, with a circulating supply is 36.64 billion $ADA.
Over the past 7 days, Cardano has experienced a 9.4% gain, while the 14-day performance shows a modest 1.8% increase. This indicates that, while $ADA experiences some short-term recovery, its long-term performance has been struggling. Investors are now closely watching the next price movements to assess whether the recovery can be sustained.
Where’s Cardano Headed?
On the technical end, a daily TradingView chart for $ADA reveals a Fibonacci retracement pattern that highlights key support and resistance levels. Currently, $ADA is trading at $0.425, with the 0.236 retracement level at $0.43594 acting as the immediate resistance. This level marks the upper boundary of recent price action. Notably, if the price breaks above it, $ADA could potentially aim for the 0 Fib retracement at $0.456.
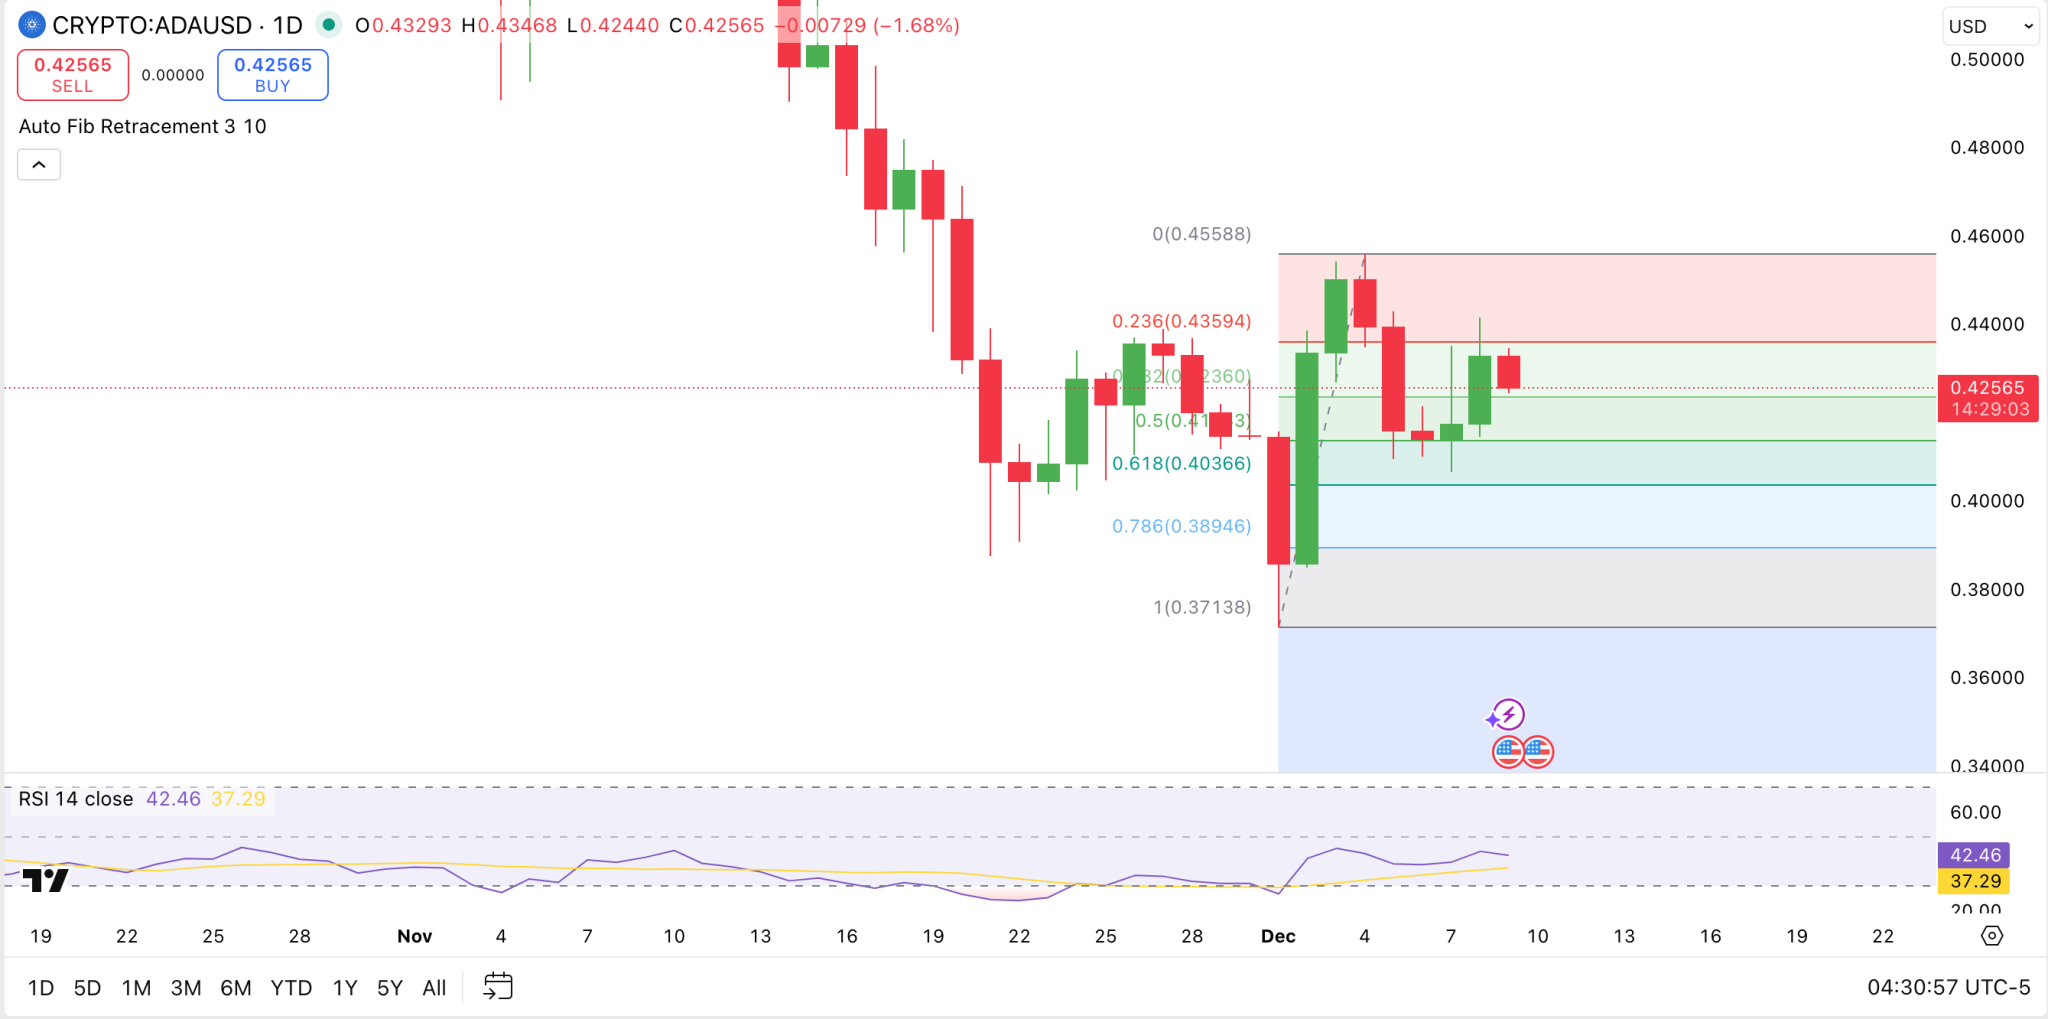
On the downside, the 0.5 level at $0.4136 serves as an immediate support zone, which could provide buying pressure if the price retraces further. The 0.618 level at $0.4037 is a stronger support level, representing a deeper retracement in case of a larger correction.
The RSI (Relative Strength Index) is currently at 42.46, which indicates that $ADA is neither in overbought nor oversold territory. This suggests a neutral momentum, with potential for further movement either way depending on broader market conditions.
Ultimately, a break above $0.4359 could trigger a bullish move, while a decline below $0.4136 might indicate a bearish trend, targeting lower levels around $0.4036.
$ADA Liquidation Data
Elsewhere, the liquidation data for Cardano reveals significant volatility in the market over the last few hours. In the past 4 hours, $13.06K in liquidations occurred, with $11.68K from long positions and $1.38K from short positions.
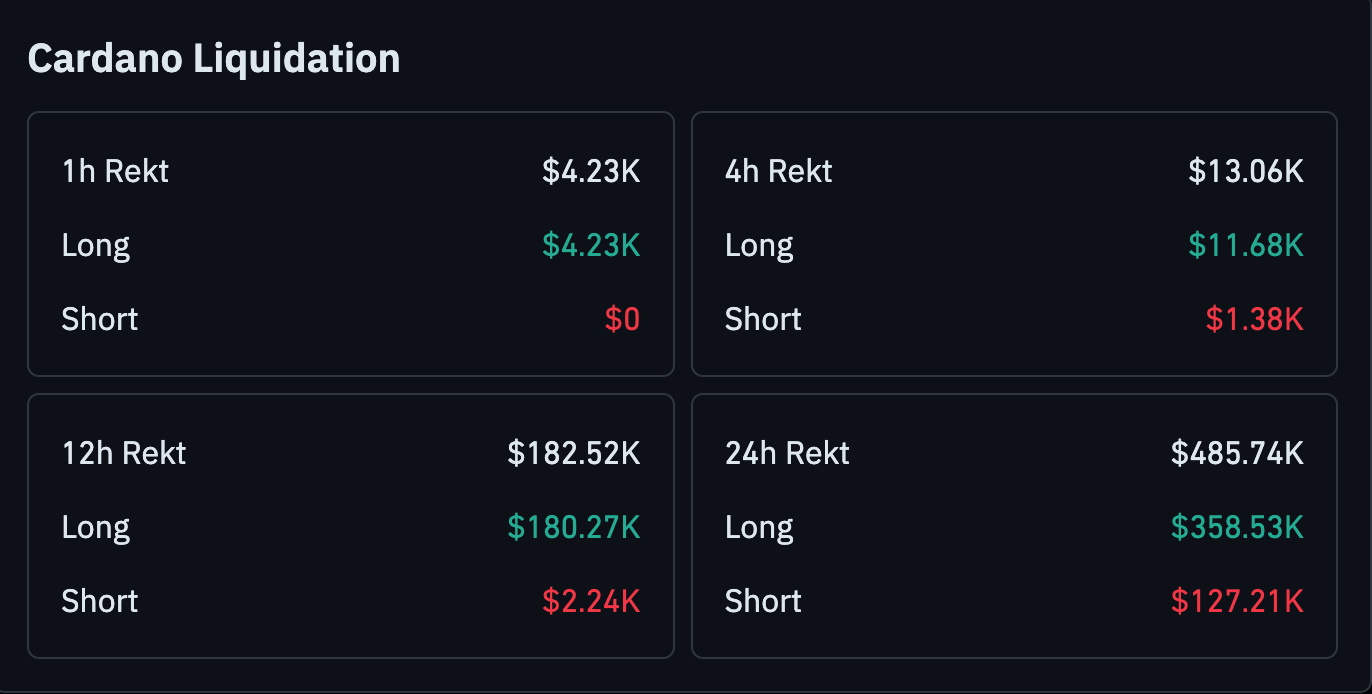
Meanwhile, over a 12-hour period, $182.52K in total liquidations were recorded, with a strong dominance from long positions at $180.27K, indicating a bearish market shift or price correction.
Further, the 24-hour liquidation data shows $485.74K in total liquidations, where $358.53K came from long positions, reflecting continued pressure on traders holding long positions amid the fluctuating market.
