


 24
24
The market could be ready for a price recovery, but at the same time, institutional flows are not that impressive, apart from XRP's ETF surge. Bitcoin and Shiba Inu are not gaining that much strength despite the lack of pressure.
Bitcoin's short-term pressure
Off its $78,000 lows, Bitcoin was able to establish a short-term uptrend. The structure appears positive on the surface, with higher lows, a consistent upward grind, and an RSI rising out of oversold territory.
However, this move's internal workings reveal a different picture. If a market wants to push into a psychological level like $100,000, the rally is taking place on declining volume, exactly the opposite of what it needs. Growing participation is necessary for a healthy breakout, particularly one aimed at a significant round number. Rather, each upward leg has been accompanied by progressively less trading volume, indicating that buyers are not entering the market with conviction.
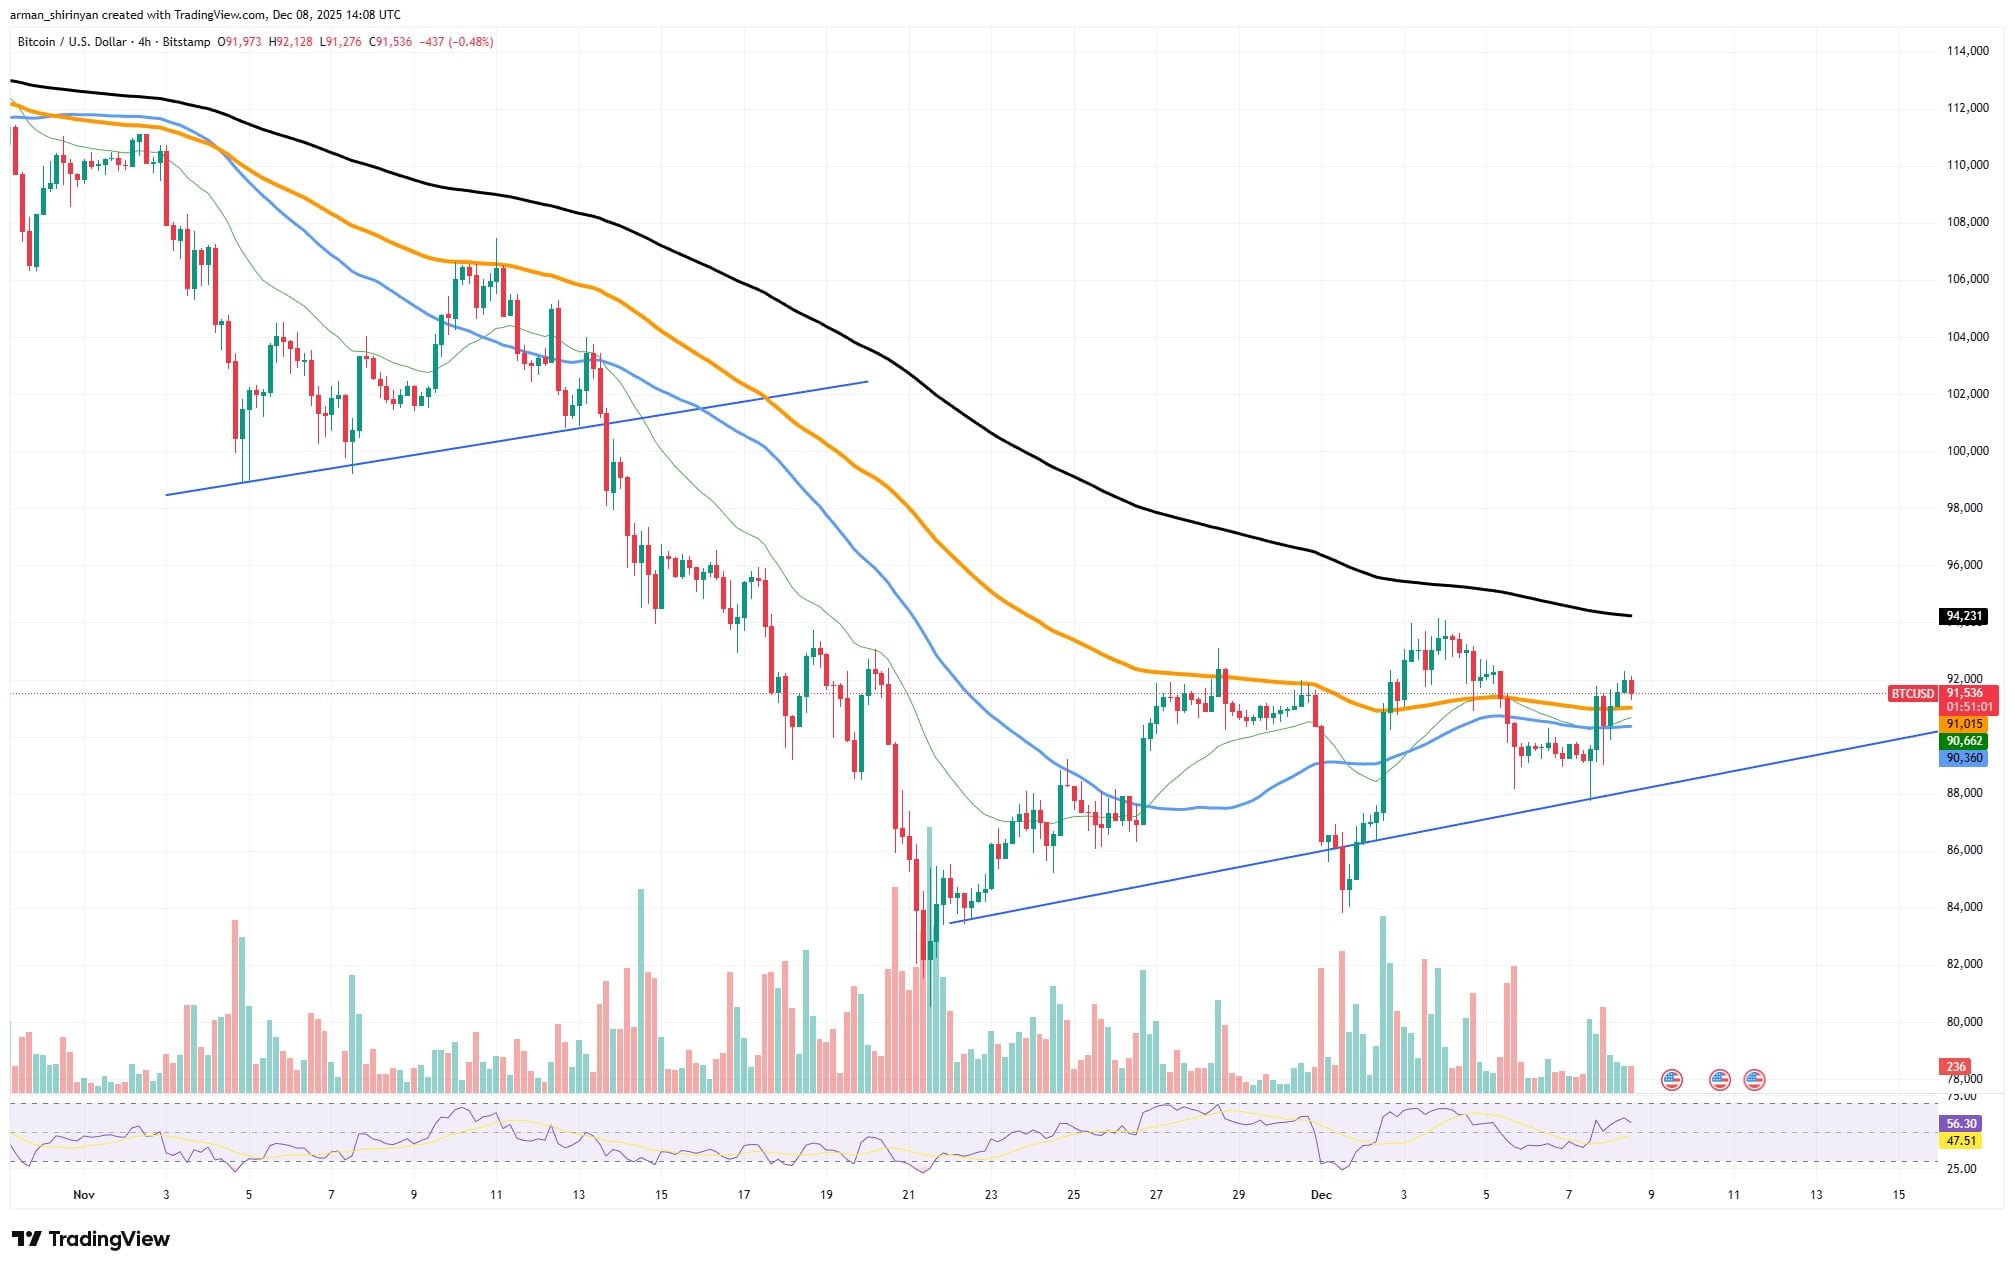
Low volume can cause the price to rise, but without a wide base of support, it cannot break through significant resistance zones. Because of this, even though the chart technically indicates an uptrend, the rally appears brittle.
This issue is exacerbated by the moving averages. The 50-day, 100-day and 200-day MAs are all sloping downward, and Bitcoin is still below them. Any attempt to enter the $98,000-$103,000 range will be met with an overwhelming amount of technical pressure. These levels are unlikely to give way in the absence of a noticeable volume expansion.
From a structural point of view, this is a typical bear-market bounce, which is neat, orderly and ultimately limited by dwindling participation. For the time being, the ascending trendline is holding, but unless buyer interest increases significantly, it becomes a liability because it could be broken by an aggressive sell day, which would cause a deeper retracement.
Stabilization not coming yet
Although Shiba Inu is beginning to show signs of recovery, it would be an exaggeration to describe this as a bull mode. Instead of a market going into a full bullish reversal, the chart shows a market trying to stabilize following a protracted sell-off.
However, if momentum keeps building, investors should not rule out the possibility of a more significant change because the recent behavior has been positive enough. The first and most significant shift is that prices are no longer hitting new lows. Since the November bottom in the $0.0000080 area held firmly, SHIB has created a number of higher lows on shorter time frames. This suggests that sellers are no longer able to drive the asset lower.
The 20-day and 50-day short-term moving averages are starting to level off, indicating that the market is entering a consolidation phase and that bearish pressure is lessening. SHIB is still trading below the 100-day and 200-day moving averages, among other major moving averages. Since those long-term indicators are still clearly pointing downward, SHIB has not yet disproved the general downward trend.
Additionally, there is no surge in buying interest or participation akin to a breakout. Any upward movement will find it difficult to maintain itself in the absence of greater volume.
What can SHIB do now? A moderate relief rally is certainly feasible. The asset may reach the heavier resistance cluster at $0.0000098-$0.0000105 if it is able to recover the 50-day MA close to $0.0000090. The first clear indication that SHIB is entering a bull market would be breaking through that zone.
Until then, investors should anticipate a gradual recovery rather than a sharp increase. Accumulation frequently starts quietly during this stage, but it takes time. SHIB is undoubtedly getting better, but it has not yet changed the course of events. Whether this stabilization turns into a true trend reversal or just another pause in a larger downtrend will be determined over the coming weeks.
XRP tumbling down
For months, XRP’s steady decline has followed a clear, distinct descending price channel. As long as the asset remains inside that structure, a downtrend will continue to be the dominant force. Bulls should take heart from the fact that XRP is now moving closer to the channel’s upper boundary, indicating that the pattern may be getting close to exhaustion. The bad news is that real volume — something the market has not displayed in weeks — is necessary to escape it.
The price is making an effort to stabilize. XRP has repeatedly defended the channel’s lower boundary, creating a subtle but significant sequence of higher lows on shorter time frames. This suggests that sellers are beginning to falter. The market is no longer in capitulation mode but has not yet entered a recovery trend, as indicated by the RSI hovering in the mid-40s.
The asset is still below each major moving average, but the decline’s slope is starting to lessen, as investors can clearly see on the chart. When XRP confidently breaks out above the descending channel, the critical moment — the point at which the price decline actually stops — occurs. A clean close above the upper trendline of the channel, probably close to the 20-day or 50-day moving averages, would indicate a change in momentum from controlled selling to possible accumulation.
However, price cannot accomplish this on its own. Any attempt at a breakout runs the risk of turning into another fleeting rejection in the absence of a discernible increase in buy-side volume. The breakout setup is currently developing, but it is not yet complete. The technical structure is tightening in the bulls’ favor, and they are closer to taking the lead than they have been in weeks.

