


 16
16
- $HBAR retests downward channel resistance at $0.20 amid Hedera price breakout
- Retest of key resistance level could see the altcoin explode in coming weeks.
- A bullish crypto market amid macroeconomic tailwinds and ETF buzz could help $HBAR price.
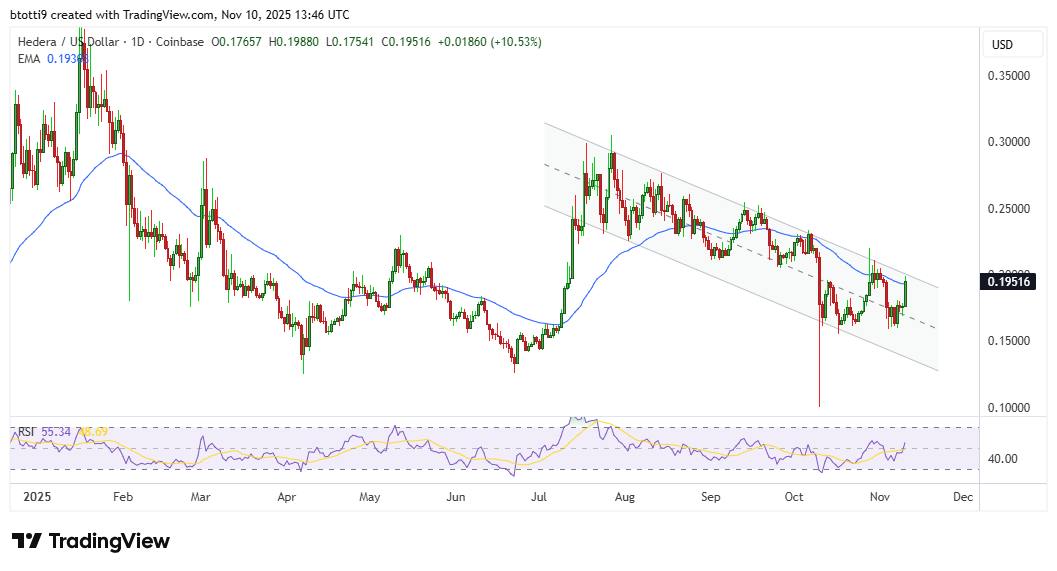
Hedera’s native token, $HBAR surged more than 14% in 24 hours as of writing to break to $0.19 amid fresh upside momentum.
As the asset hovers near the critical technical level of $0.20, a sustained rally could take bulls to $0.29 or higher in the coming weeks.
Hedera price gains as markets bounce
The cryptocurrency sector experienced a robust rebound on November 10, 2025, propelled by renewed optimism in risk assets.
Much of the early upside that pushed Bitcoin to highs above $106,000 and $HBAR to near $0.20 followed a pivotal US Senate agreement to avert a protracted government shutdown.
After 40 days of fiscal uncertainty that had weighed heavily on global markets, a compromise to advance a funding bill to reopen federal agencies through January is on the table.
This deal, which includes a future vote on extending Affordable Care Act subsidies, has alleviated fears of economic disruption, injecting fresh liquidity into equities and digital assets alike.
Bitcoin ($BTC), the market bellwether, spearheaded the surge, reclaiming the $106,000 mark with a 4% intraday gain.
This marked a sharp reversal from weekend lows near $99,000, which coincided with nearly $1.2 billion in weekly outflow from exchange-traded products.
The recovery reflects stabilizing sentiment post-deleveraging, with $BTC’s momentum spilling over to altcoins.
$HBAR price outlook
As noted, the uptick in crypto aligns with general market gains.
Hedera, which surged amid approval for the $HBAR ETF recently, capitalized on the mega-cap tokens’ uptick.
On the day, $HBAR surged more than 12%, climbing from lows of $0.17 to hover near $0.20.
Meanwhile, over the past week, $HBAR has rebounded 8%.
Technically, $HBAR’s ascent has brought it squarely to the upper boundary of a multi-month downward channel.
Bears have shown strength upon multiple retests of the upper resistance boundary, with the latest meeting point near $0.20.
This level, etched from the July highs of $0.30, coincides with the 50-day exponential moving average (EMA).
Currently, the EMA is near $0.1930, which means the area can be a formidable confluence for sellers.
Chart patterns indicate $HBAR has traced a descending trajectory since July, with repeated lower highs and lower lows reinforcing bearish control.
However, the current probe at $0.20, amid elevated short interest and a daily volume surge of 122%, hints at a likely breakout.
 $HBAR Chart">
Bears appear poised to defend this zone aggressively, potentially triggering a retracement to prior support levels.
A decisive close above $0.20, with sustained volume, could invalidate the bearish channel.
This breach would signal a shift toward a bullish flag resolution, with momentum indicators like the Relative Strength Index (RSI) hinting at a rally to $0.29.
The mark is a prior resistance from late July.
However, a breakdown below $0.20 could accelerate selling toward the channel’s lower trendline.
The middle point is around $0.16-$0.14, while a deeper rout would mean a retest of $0.12.