


 27
27
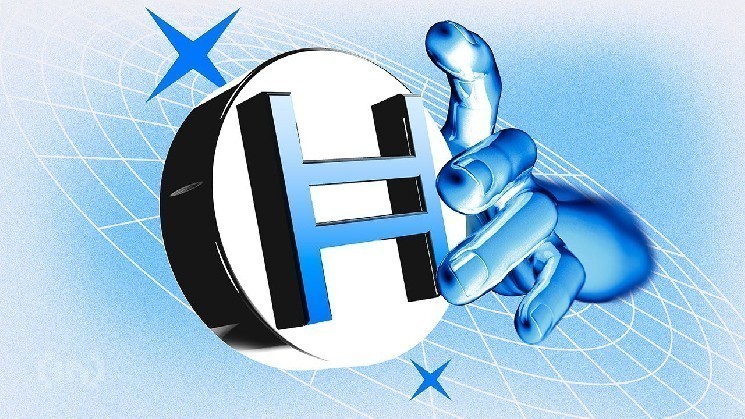
The $HBAR price has been moving within a narrow range, indicating that buyers and sellers are still competing for control. Over the past month, it has declined by about 21%, with a 11% weekly loss. Yet compared to Bitcoin and Ethereum, $HBAR’s losses have slowed.
The chart now captures a tug-of-war between long-term weakness and early buying signs. Momentum is improving, but long-term signals still flash caution. Whether the balance holds or breaks could depend on how whales act next.
Buyers Push Back As Sellers Hold The Line
On the daily chart, $HBAR shows two signals moving in opposite directions. A bearish crossover is forming between the 100-day and 200-day Exponential Moving Averages (EMAs). EMAs smooth out price data to show long-term trend direction.
When a shorter EMA drops below a longer one, it signals that momentum is weakening and long-term sellers are still exerting pressure on the price. And that sets up a correction-like move.
 $HBAR">
Want more token insights like this? Sign up for Editor Harsh Notariya’s Daily Crypto Newsletter here.
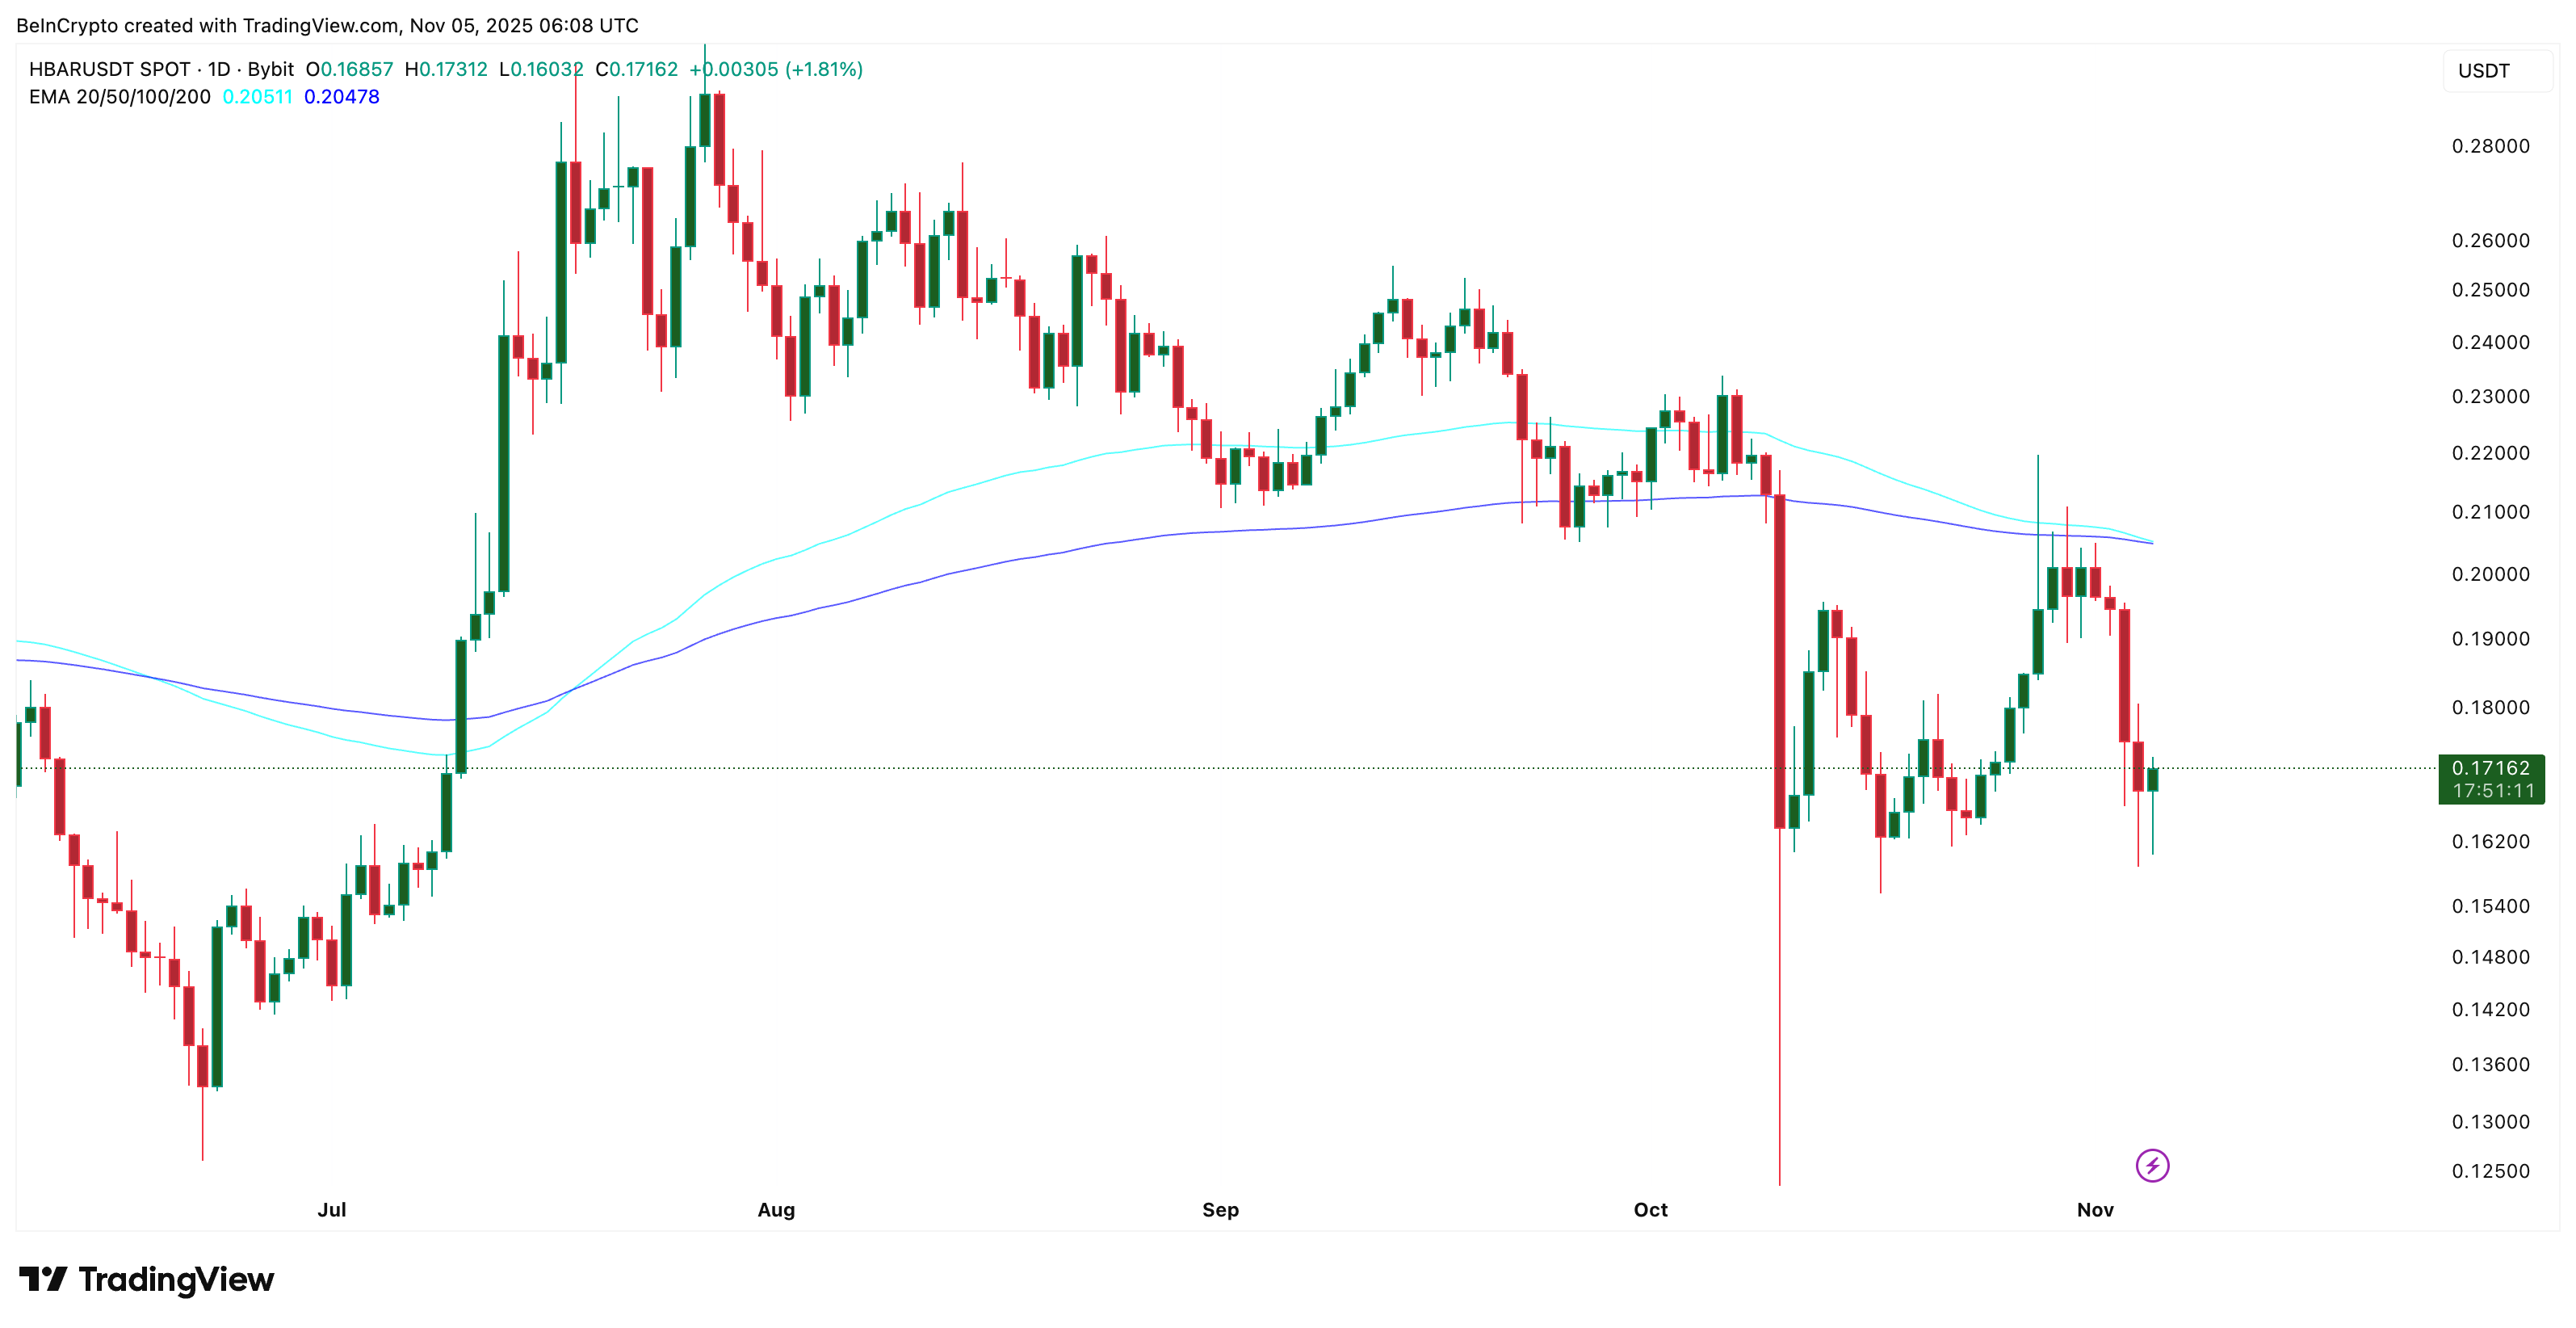
But not all indicators agree. Between October 23 and November 4, the price made a lower low, while the Relative Strength Index (RSI) — which measures whether an asset is overbought or oversold — formed a higher low.
This setup is called a bullish divergence. It usually means that selling pressure is slowing and buyers are starting to return with some hope.
That split defines $HBAR’s current phase. Momentum hints at recovery, but the overall trend remains under pressure. This push-and-pull could keep the $HBAR price locked in a range that has held since October 11.
The range shows balance — short-term buyers testing strength while long-term sellers still defend resistance.
Whales Add Positions As Money Flow Strengthens, Aiming To Lift $HBAR Price
While the technical picture looks divided, on-chain data shows that large investors may already be taking the buyer’s side.
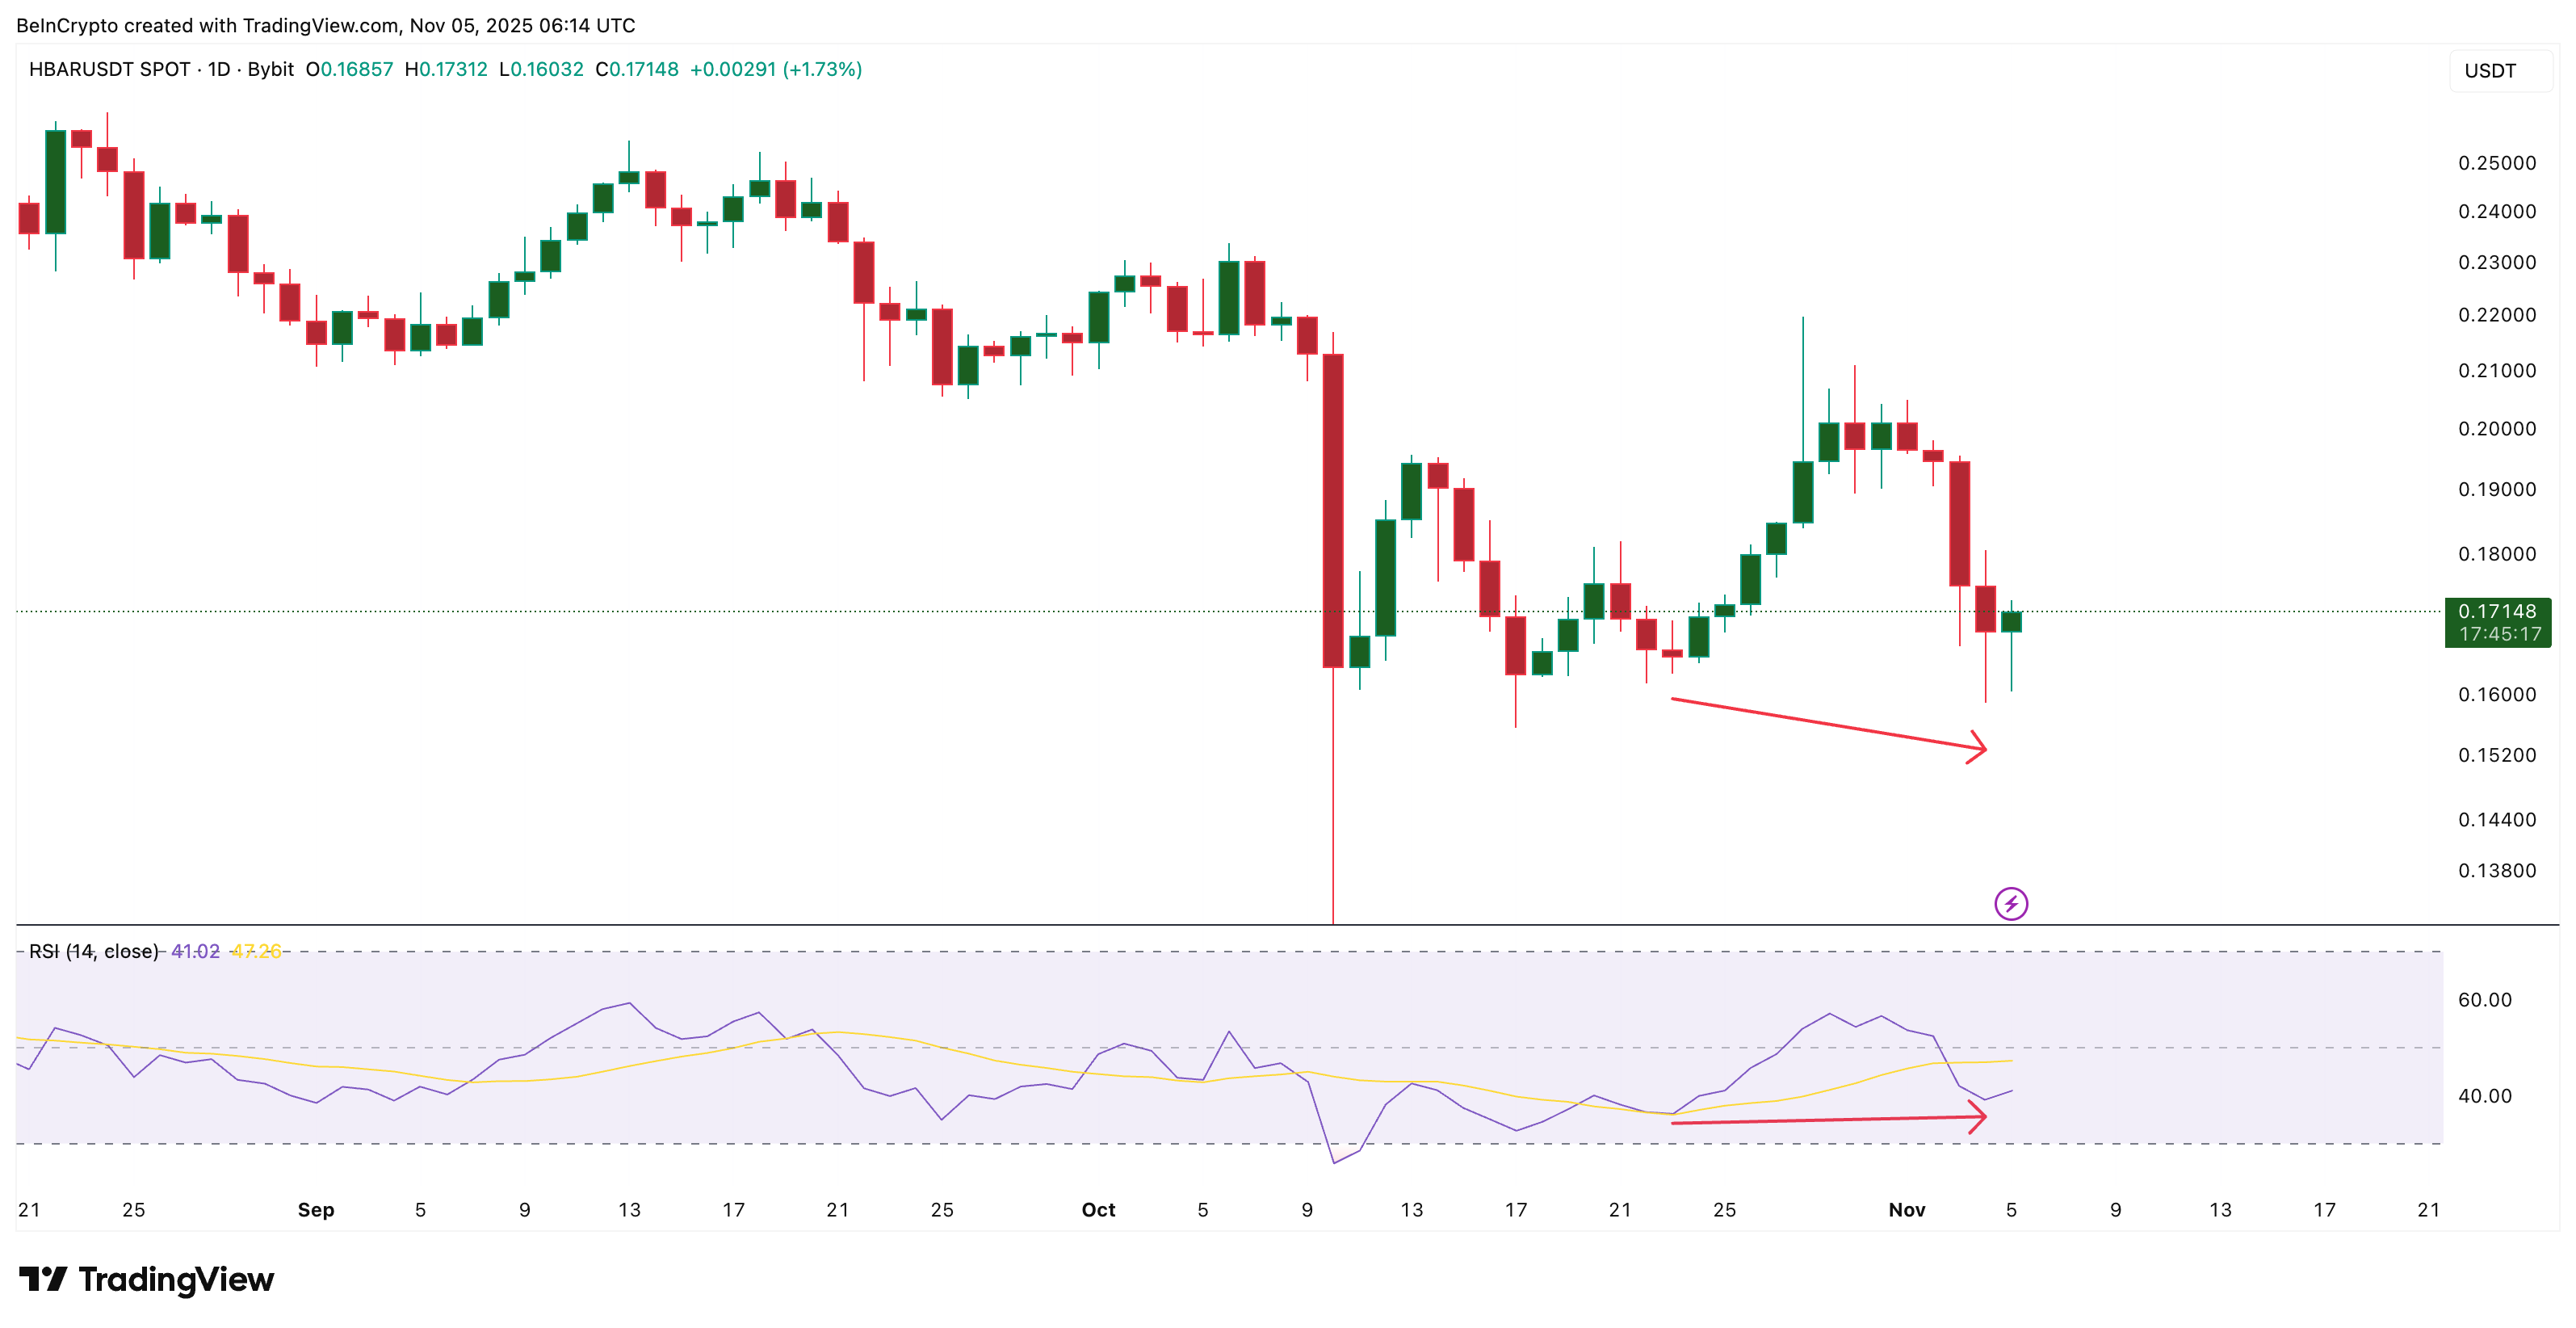
The Chaikin Money Flow (CMF) — which measures money moving in and out of the asset — has been rising since November 3, even as the $HBAR price dipped. When CMF rises while the price falls, it indicates that significant capital is entering, often driven by whales and long-term holders.
 $HBAR">
This divergence between price and money flow shows that whales are quietly buying the dip while the market debates direction. Between November 3 and 5, as prices fell toward $0.16, CMF strengthened — signaling that inflows are building against short-term selling.
If CMF continues above 0, it would confirm steady accumulation and could help $HBAR push toward the upper end of its range near $0.20. But if whales eventually slow down, the lower level of the range could get exposed.
As for the range that has been holding since October 11, $0.16-$0.20 is the one to focus on.
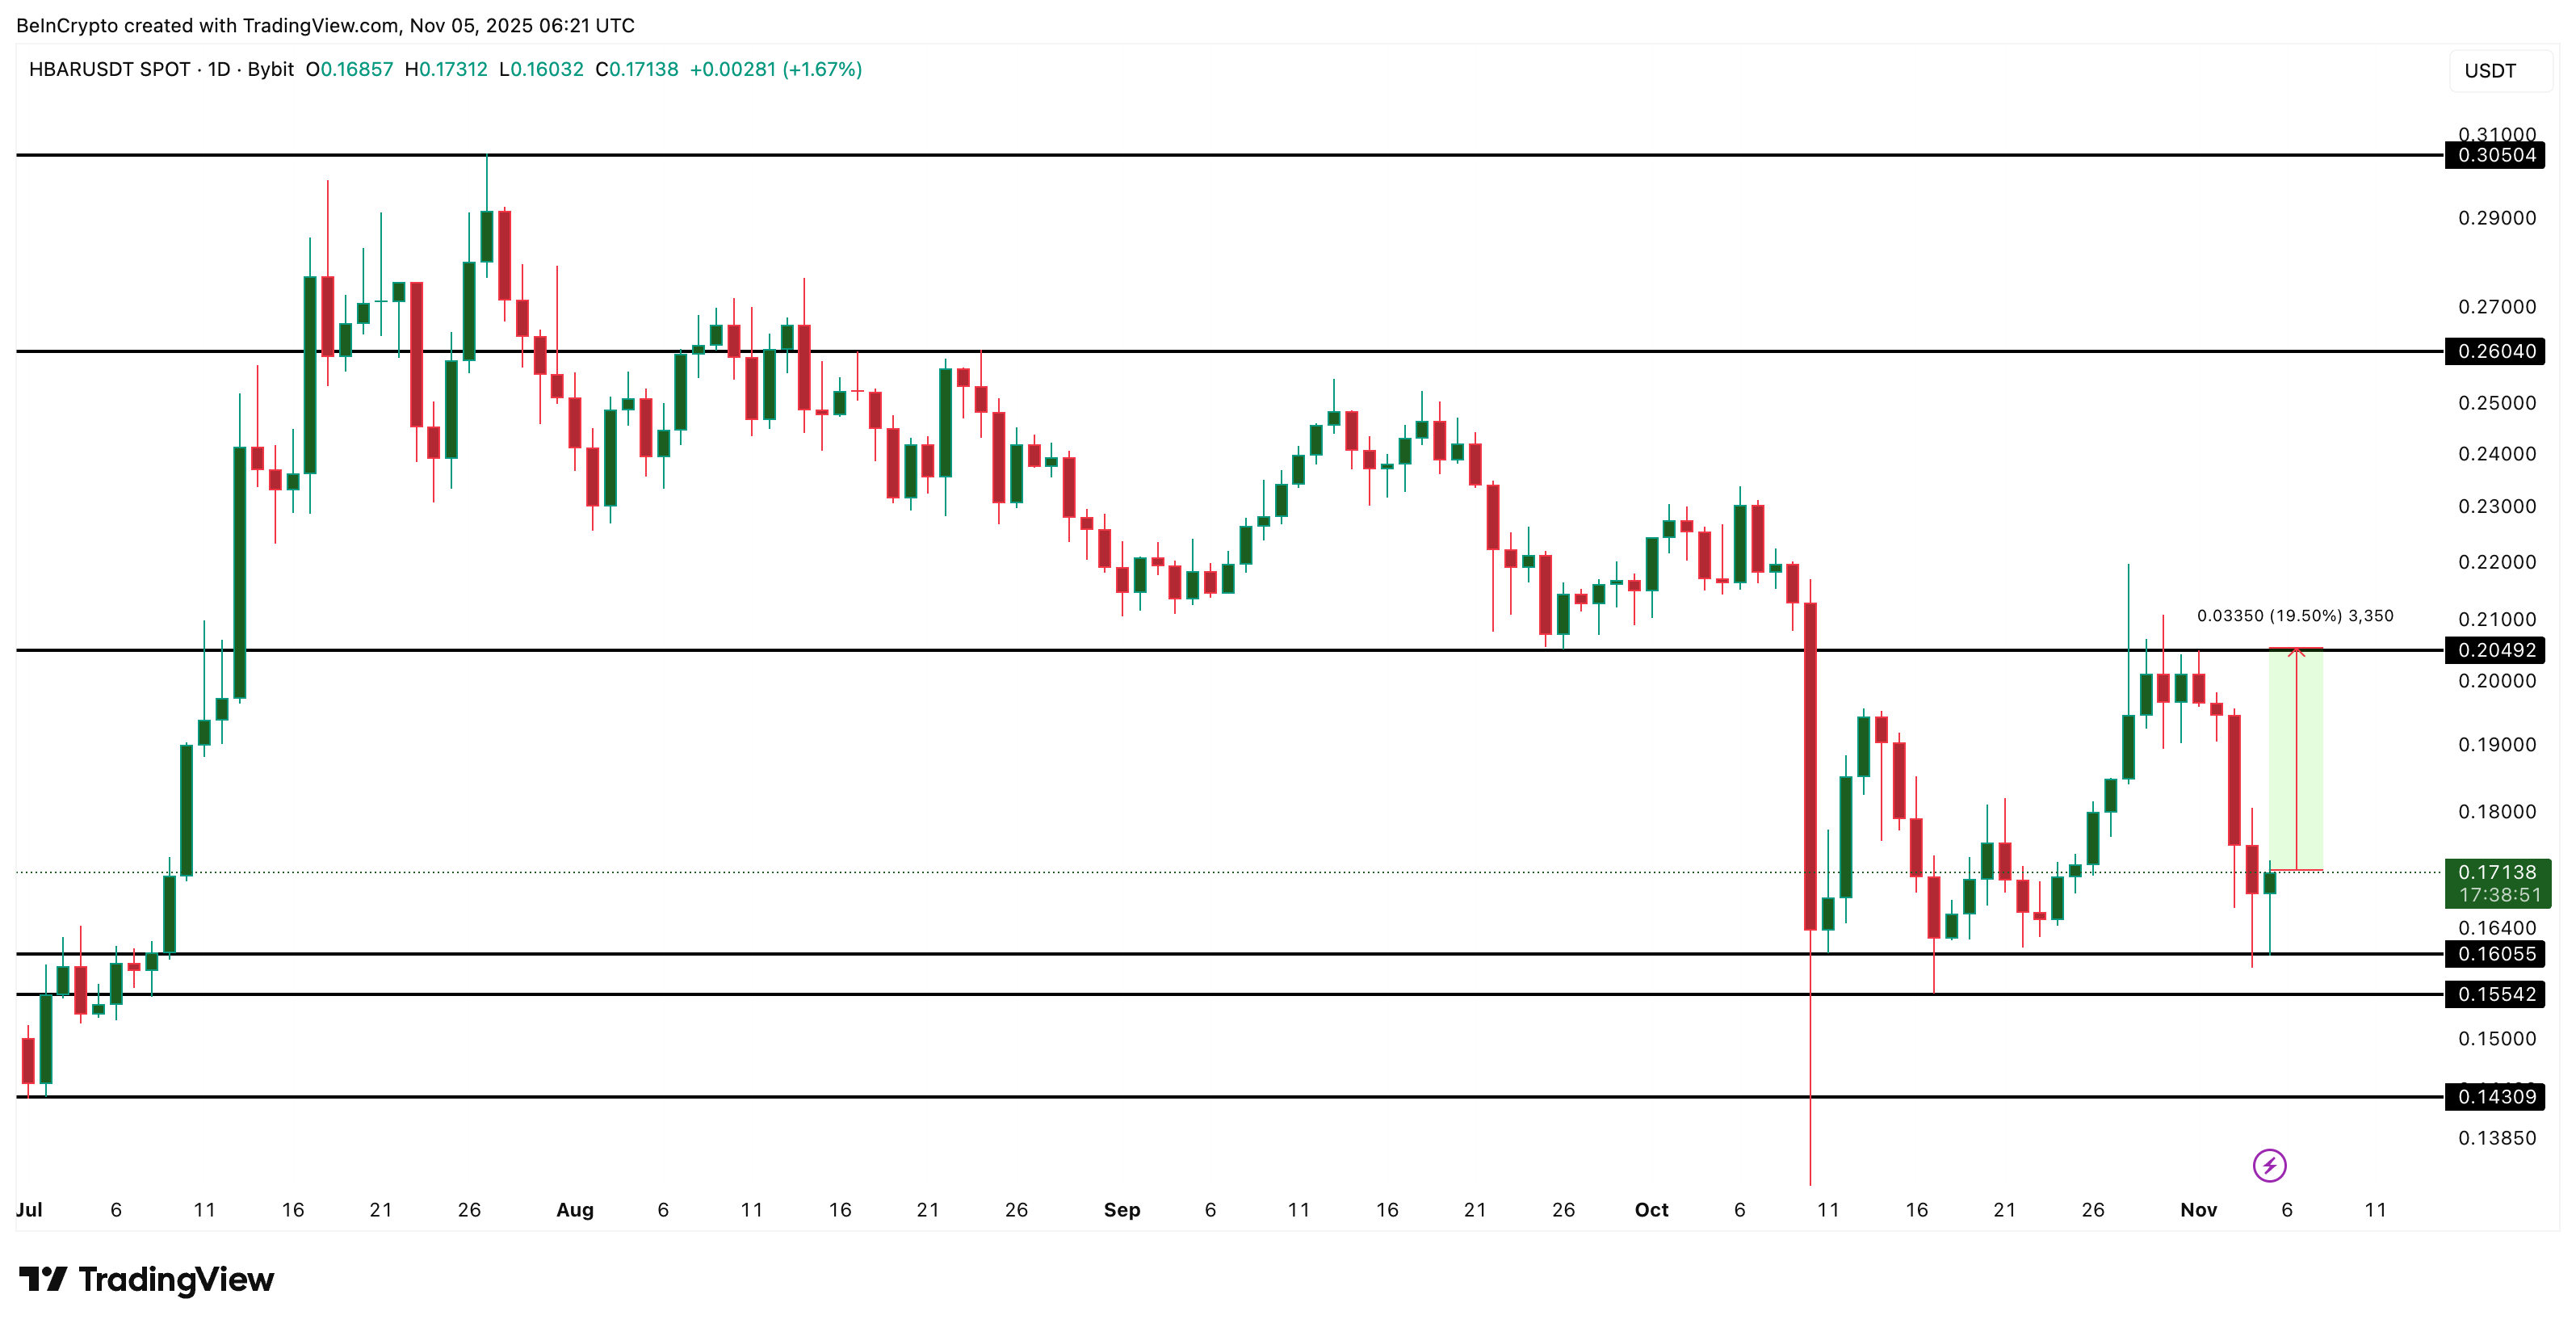 $HBAR Price Analysis">
A breakout and daily close above $0.20 would be the first sign of real bullish momentum. However, if the price breaks below $0.16, it could expose $0.14, another critical support level.
The post $HBAR Price Walks a Tightrope Between Sellers and Buyers — Can Whales Tip the Balance? appeared first on BeInCrypto.