


 22
22
A recent analysis has drawn similarities between the current $ADA/$BTC trend and the 2021 cycle, suggesting that Cardano could see greater highs.
Notably, Beastlorion shared what he called “Cardano hopium” in his Monday X post. His optimistic approach comes as sideways price action persists for the 10th-largest cryptocurrency by market cap.
In the past 24 hours, $ADA has pulled back by nearly 6%, taking its seven-day decline to 20.2%. Data further identifies a 25% retracement over the past month, with its year-to-date performance standing at a negative 19%.
Meanwhile, a breakout ensued around July 2020, with $ADA breaking out against $BTC and pushing the descending trendline. The outburst ensured that Cardano outperformed Bitcoin, rallying to its cycle top of $3.10 while the $ADA/$BTC chart topped at 0.00006271 by September 2021.
The chart shows that a similar pattern is repeating. After the 2021 top, $ADA regressed against Bitcoin within another descending trendline until its lows of 0.00000470 in November 2024. Cardano’s bullish price action in November prompted a breakout from the resistance trendline to the top of 0.00001380 in early December.
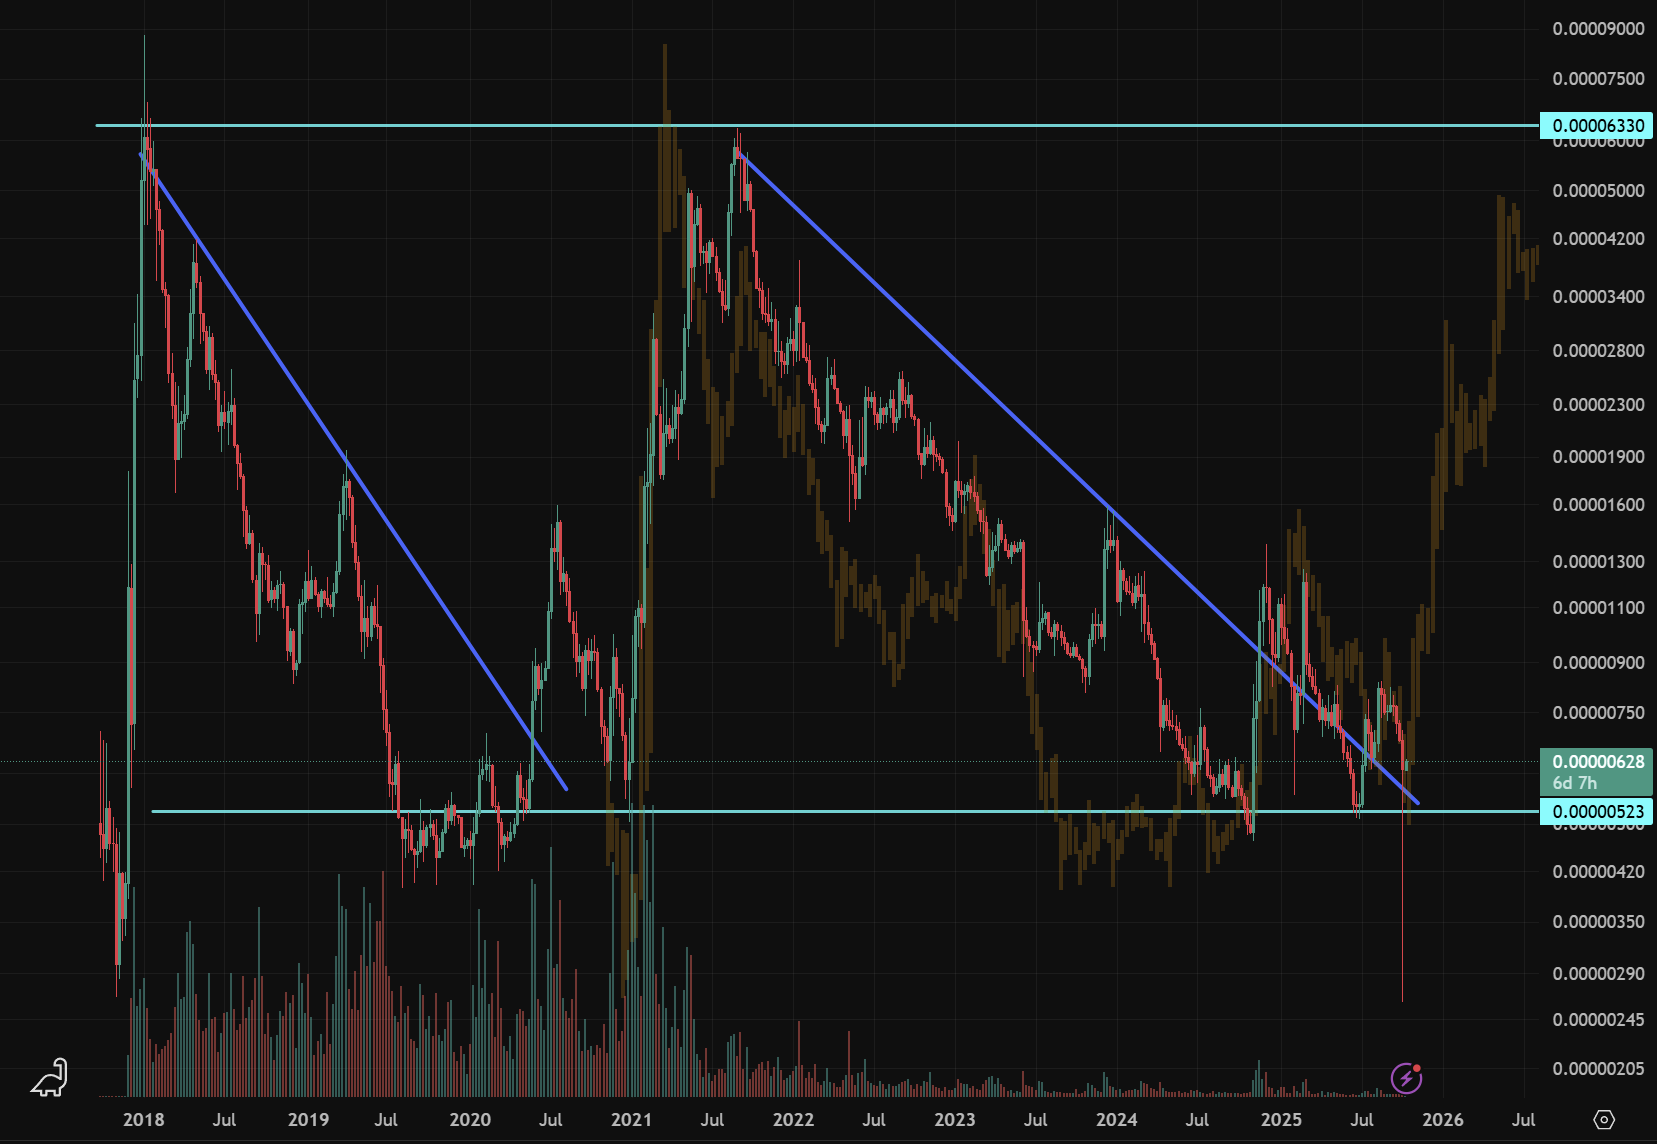 $ADA/$BTC Chart">
Cardano Could Follow Past Price Action
Now, $ADA is retesting the trendline breakout, a pattern it observed in 2020 before the final rally. If Cardano receives similar momentum from the 2020 breakout, then it could see more upside.
The chart shows a possible surge from the current price of 0.000006 to 0.000050, which would boost the price of $ADA to $5.5 at the current $BTC price of $110,855. Meanwhile, at Bitcoin’s all-time high of $126,220, this could culminate in a Cardano price of $6.3.
Notably, while $ADA did not reach its 2018 highs against Bitcoin in 2021, it still managed to make a new all-time high. This analogy suggests that the token could still reach unprecedented prices even if it doesn’t reach its 2021 high against $BTC.
Nonetheless, this depends solely on the performance of Bitcoin. It also bears mentioning that a growing $ADA/$BTC chart does not mean that Bitcoin is in a bearish trend. It only implies that Cardano is performing better.
Remarkably, the chart shows a massive decline in trading volume between the 2021 bull cycle and the current market condition. The discrepancy, among others, raised doubts over the possibility of a repetition.