Sellers are back in the game after bulls' domination, according to CoinStats.
SOL/USD
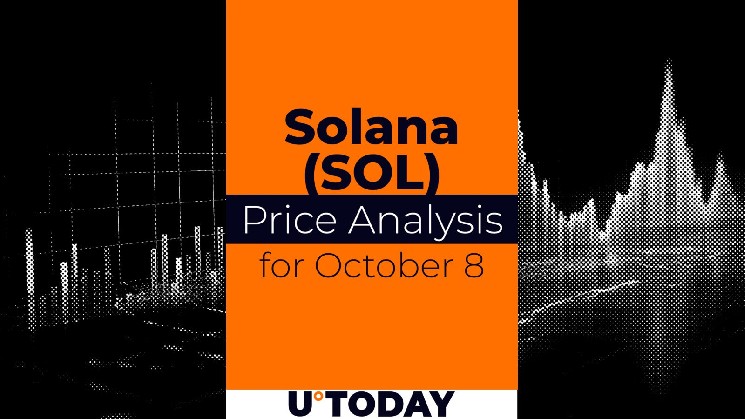
Solana (SOL) is one of the biggest losers today, falling by 4.33%.
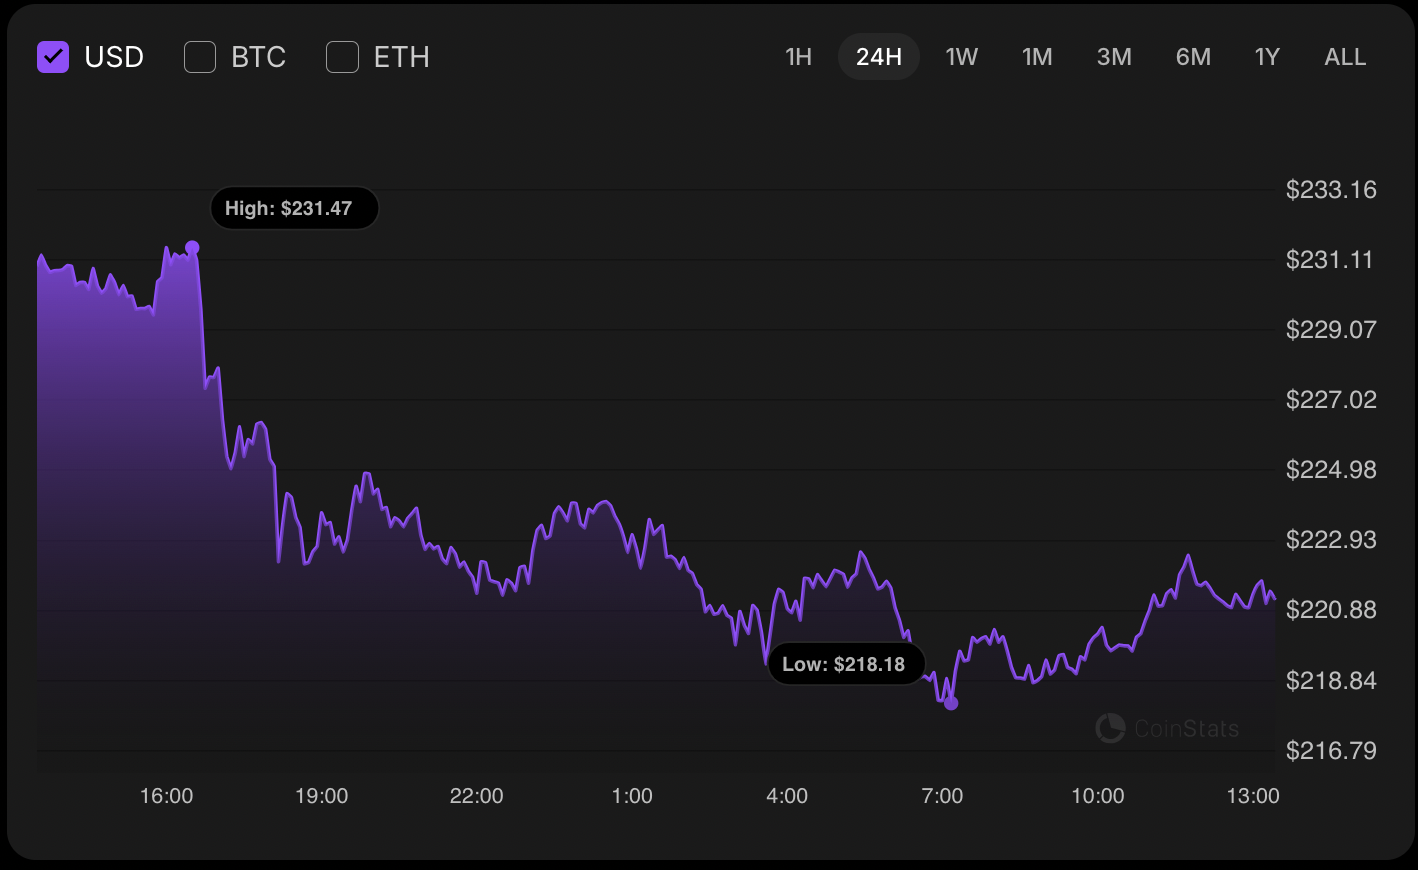
On the hourly chart, the rate of SOL is near the local resistance of $222.78.
If bulls can hold the gained initiative, one can expect a level breakout, followed by a further upward move to the $225 zone.
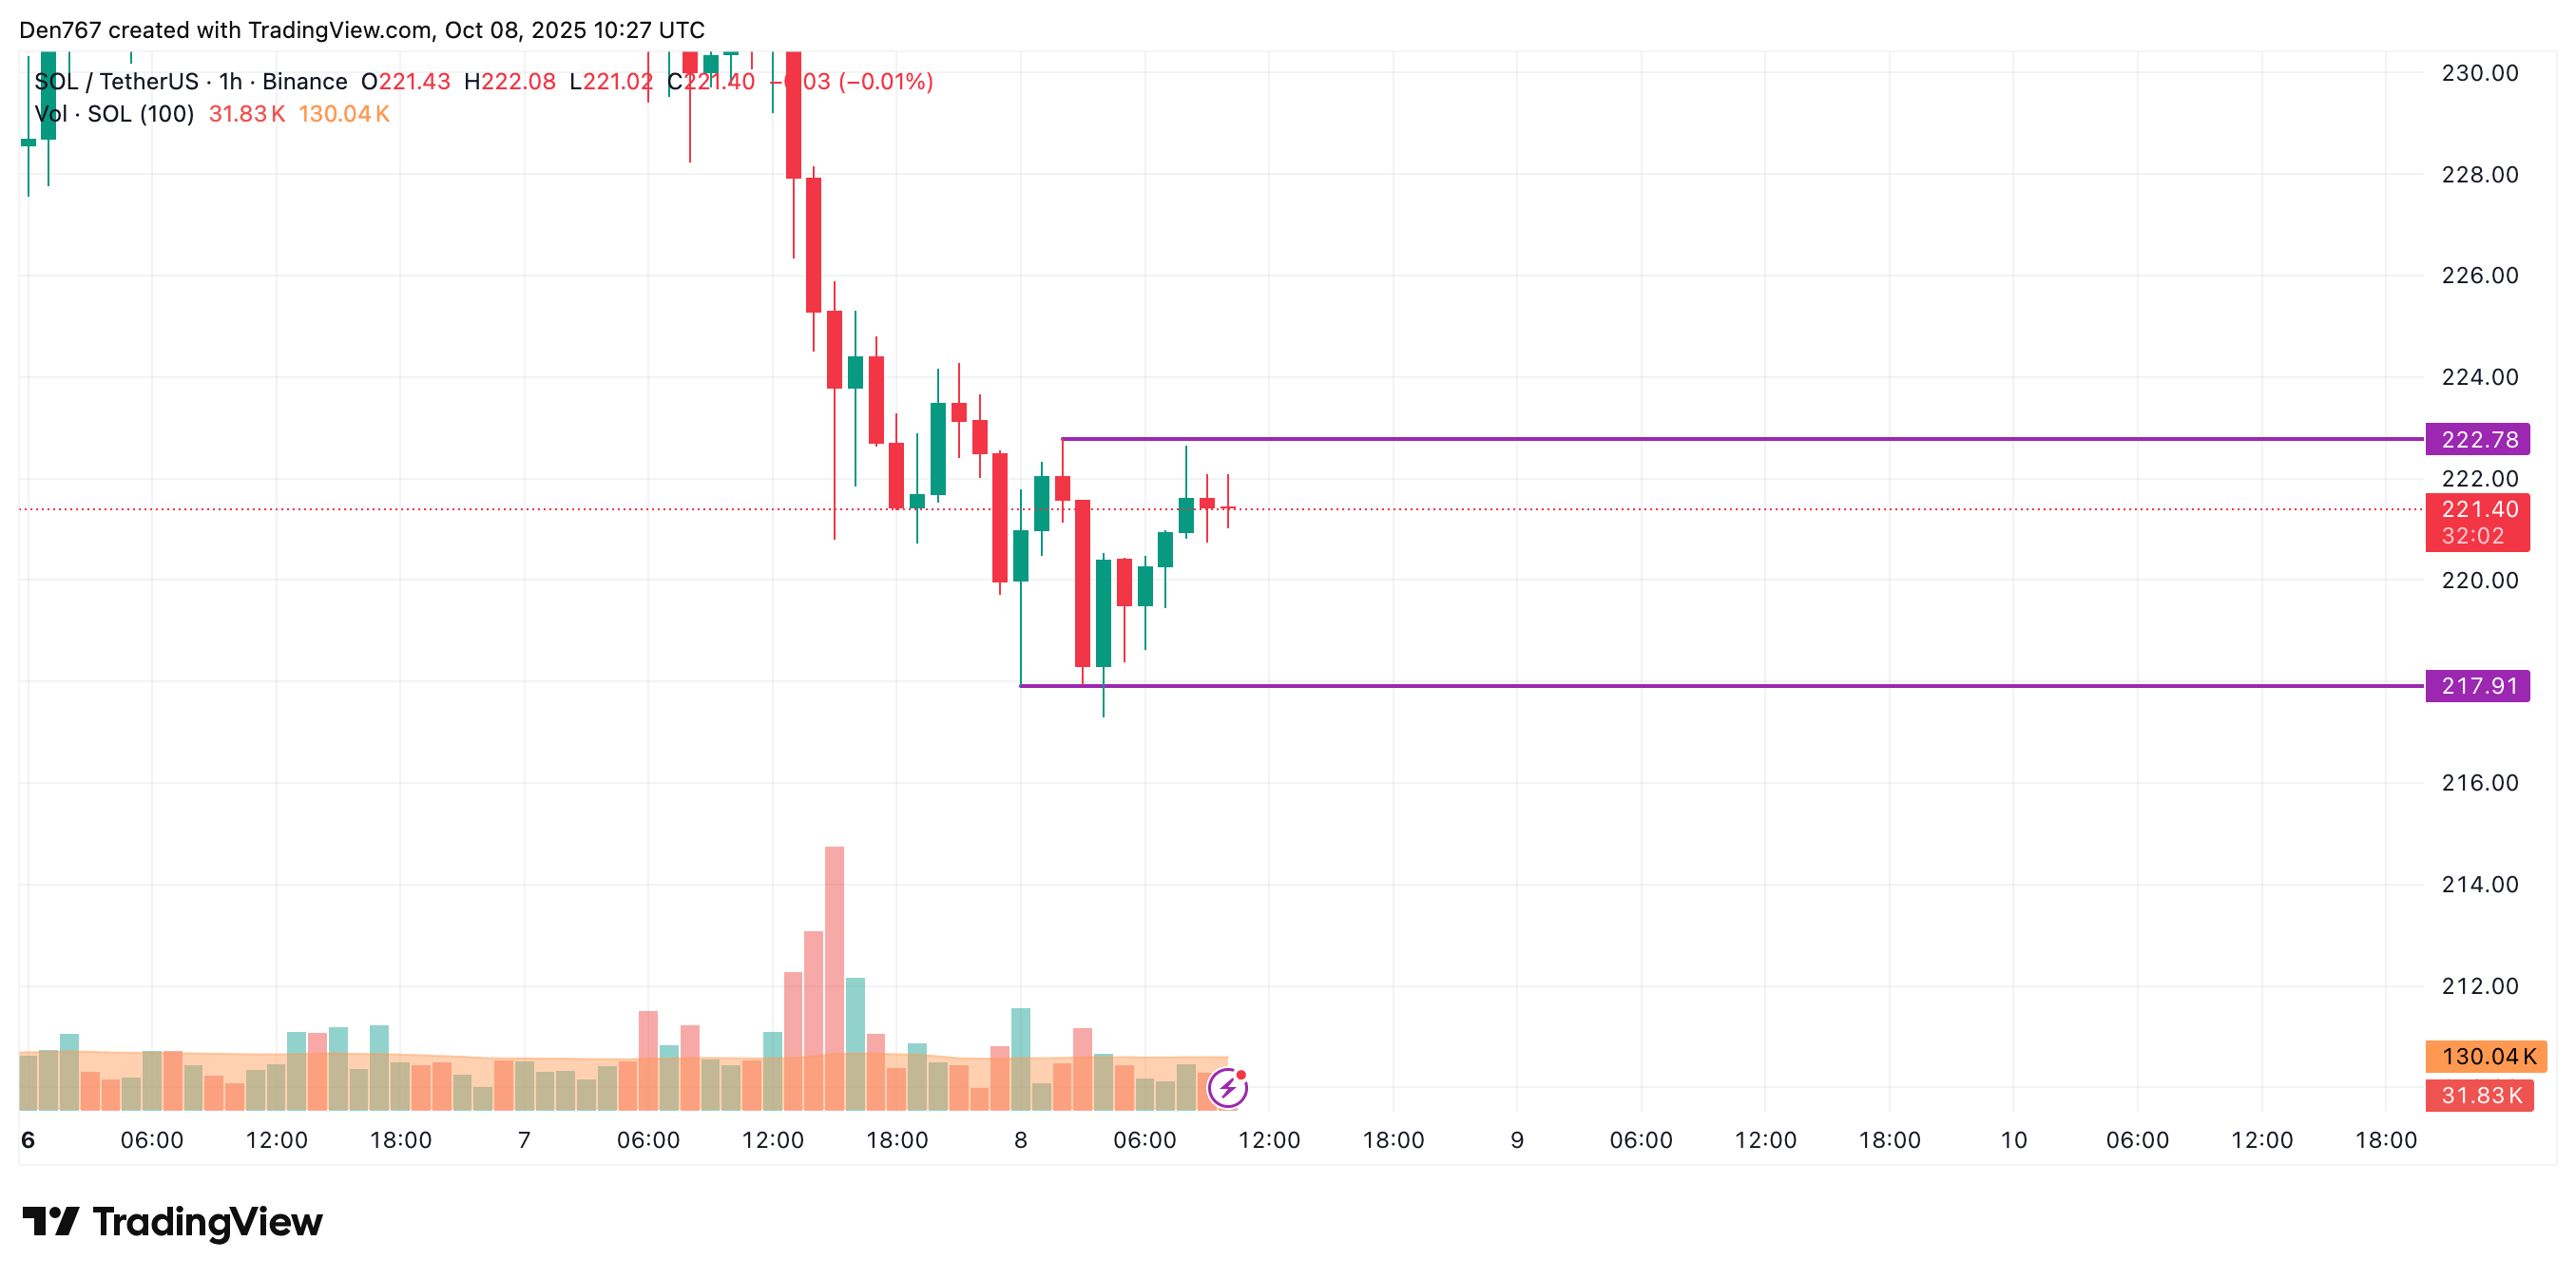
On the longer time frame, the price of SOL is again testing the support level of $219.52. However, if the bounce back occurs, traders may witness a local rise to the $224 range.
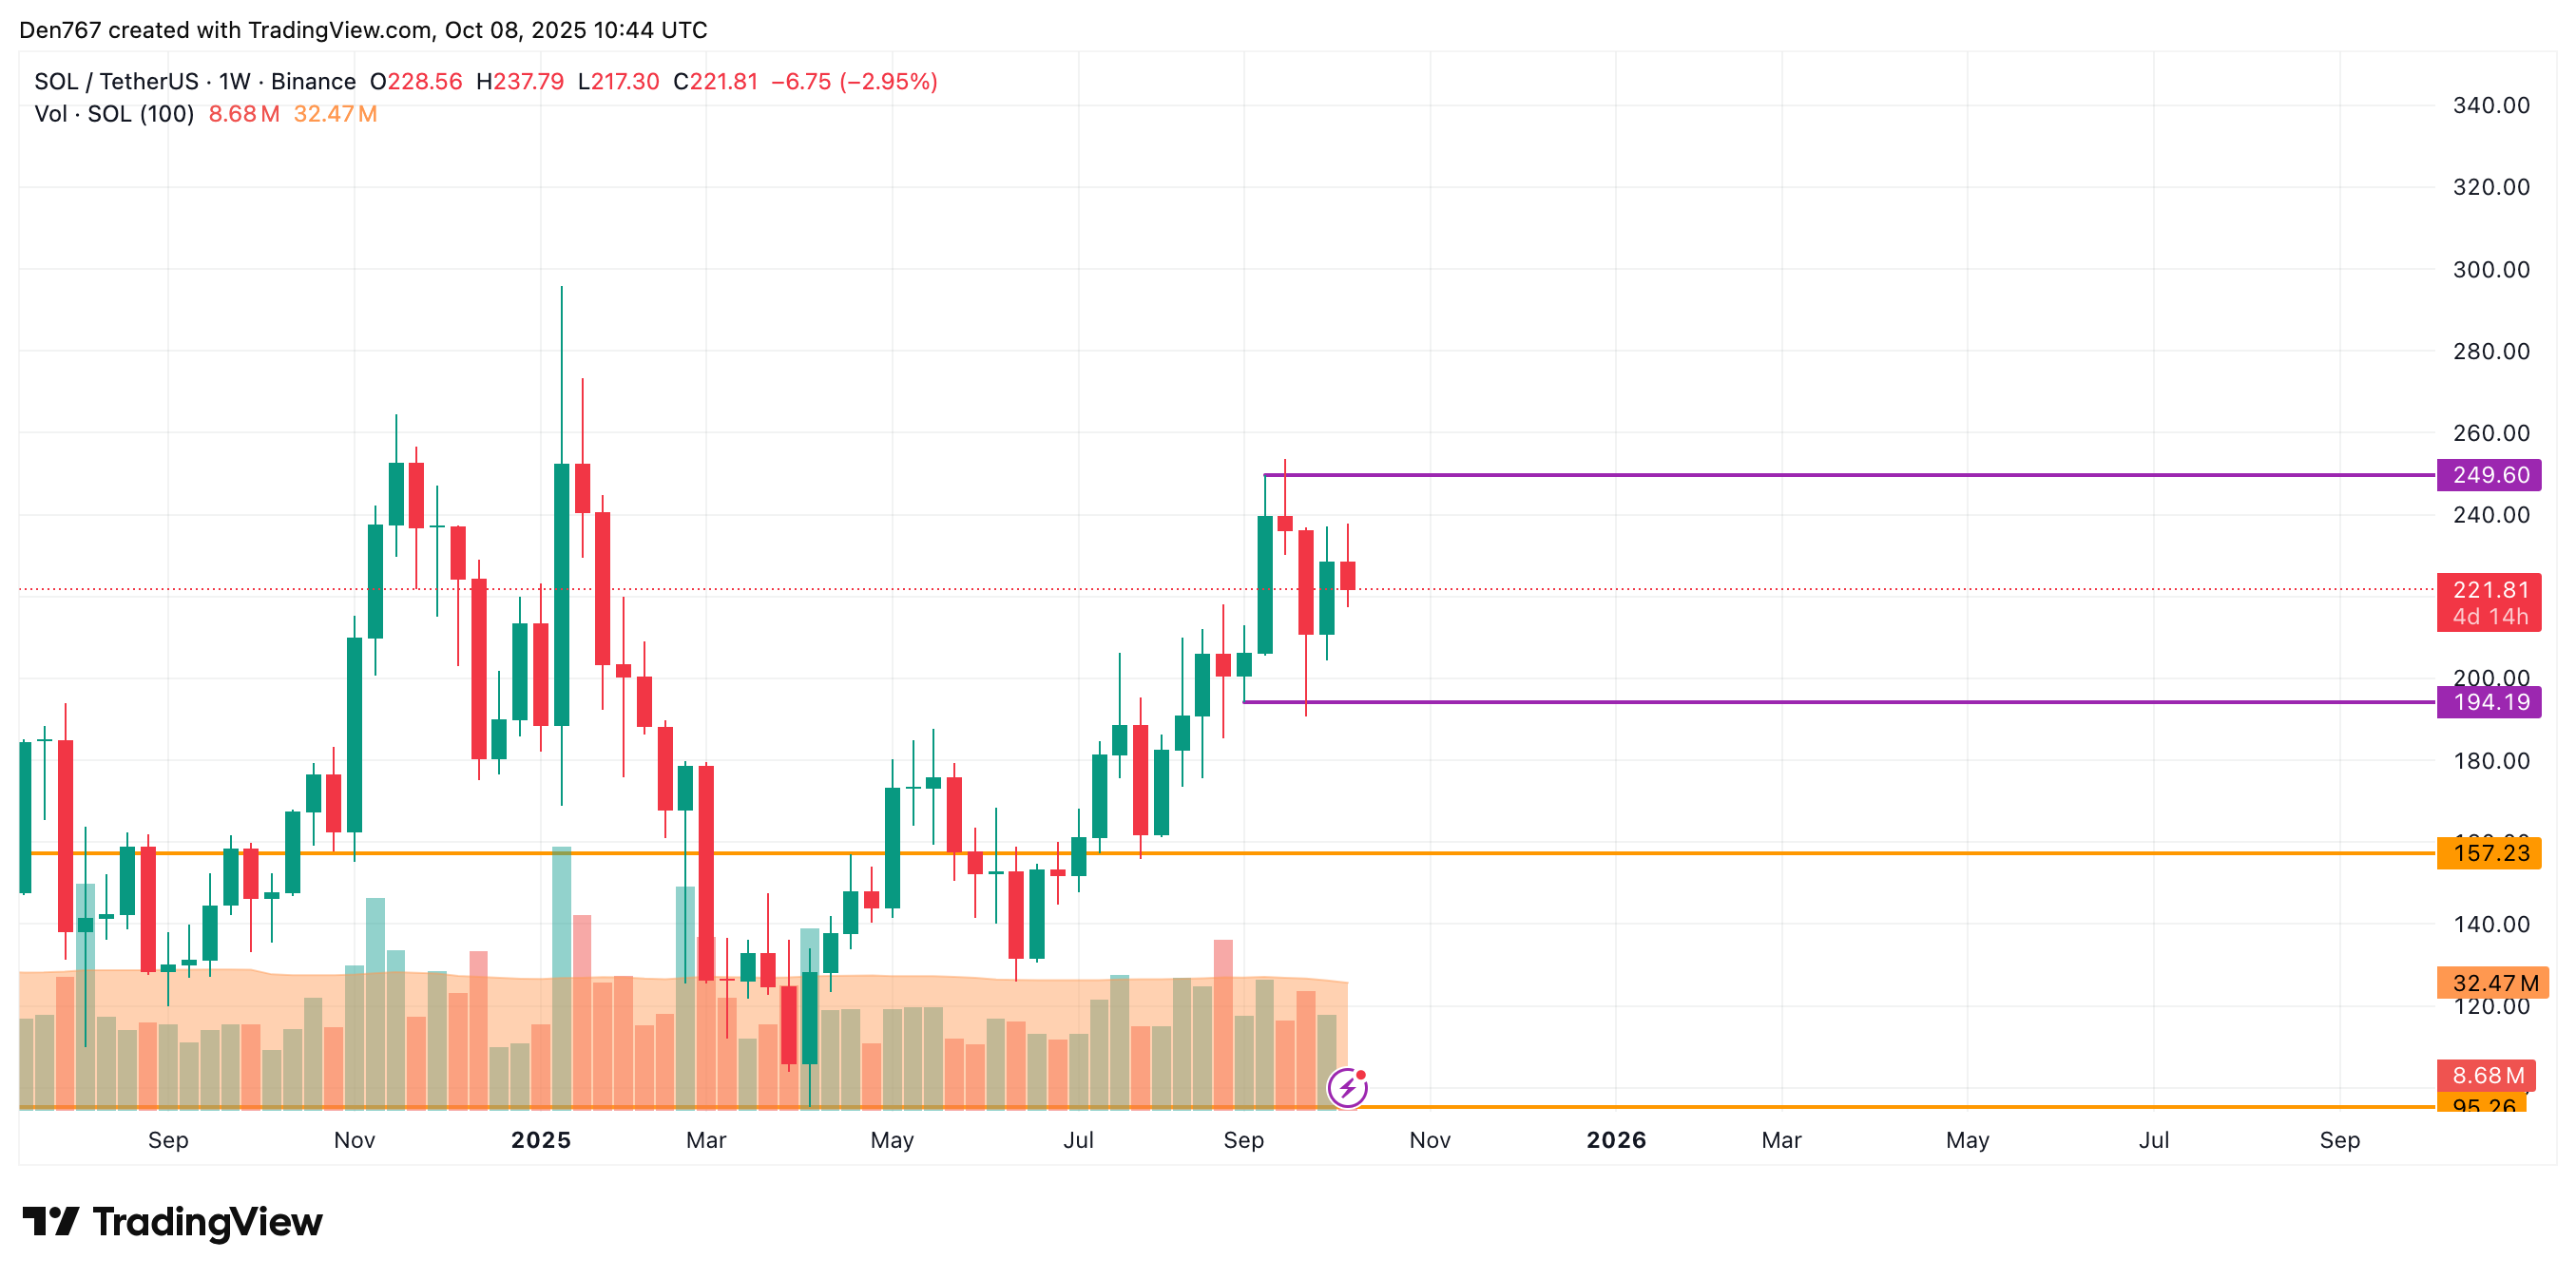
From the midterm point of view, the rate of SOL is far from the support and resistance levels. The volume has declined, which means none of the sides is ready for a sharp move. All in all, sideways trading in the area of $210-$230 is the most likely scenario.
SOL is trading at $221.81 at press time.