


 26
26
$HBAR price could be on the verge of a strong bullish breakout after forming a flag pattern despite the ongoing Hedera Hashgraph stablecoin woes.
- Hedera price is in the second phase of the Elliot Wave.
- It has also formed a bullish flag chart pattern.
- The stablecoin supply on $HBAR has continued being highly volatile.
Hedera ($HBAR) token was trading at $0.24 at last check on Sunday, Sep. 21, down by 22% from its highest point this year. Its price is about 88% above its lowest level this year.
Hedera Hashgraph’s primary catalyst is the upcoming deadline for the spot $HBAR ETF, which will be on Nov. 8. There is a chance that the agency will approve the fund, as Hedera is a highly liquid Made in the USA coin. It has a market capitalization of over $10 billion and a daily volume of over $500 million.
The odds of an $HBAR ETF approval will likely rise after the SEC delivers its verdict on several funds like Solana and $XRP in October. If approved, the ETF will likely launch within weeks since it is on the Depository Trust & Clearing Corporation (DTCC) list.
Still, Hedera’s network has a significant risk in that the stablecoin supply has been erratic in the past few months. DeFi Llama data shows that the supply stands at $69 million, down from $149 million last Friday.
The $HBAR supply also plunged from $208 million on July 31 to $54 million on Aug. 3. Before that, it moved from $212 million on May 26 to $76 million on Aug. 30. It is unclear why this is happening. Still, it could be that one or more entities are influencing the action.
$HBAR price technical analysis
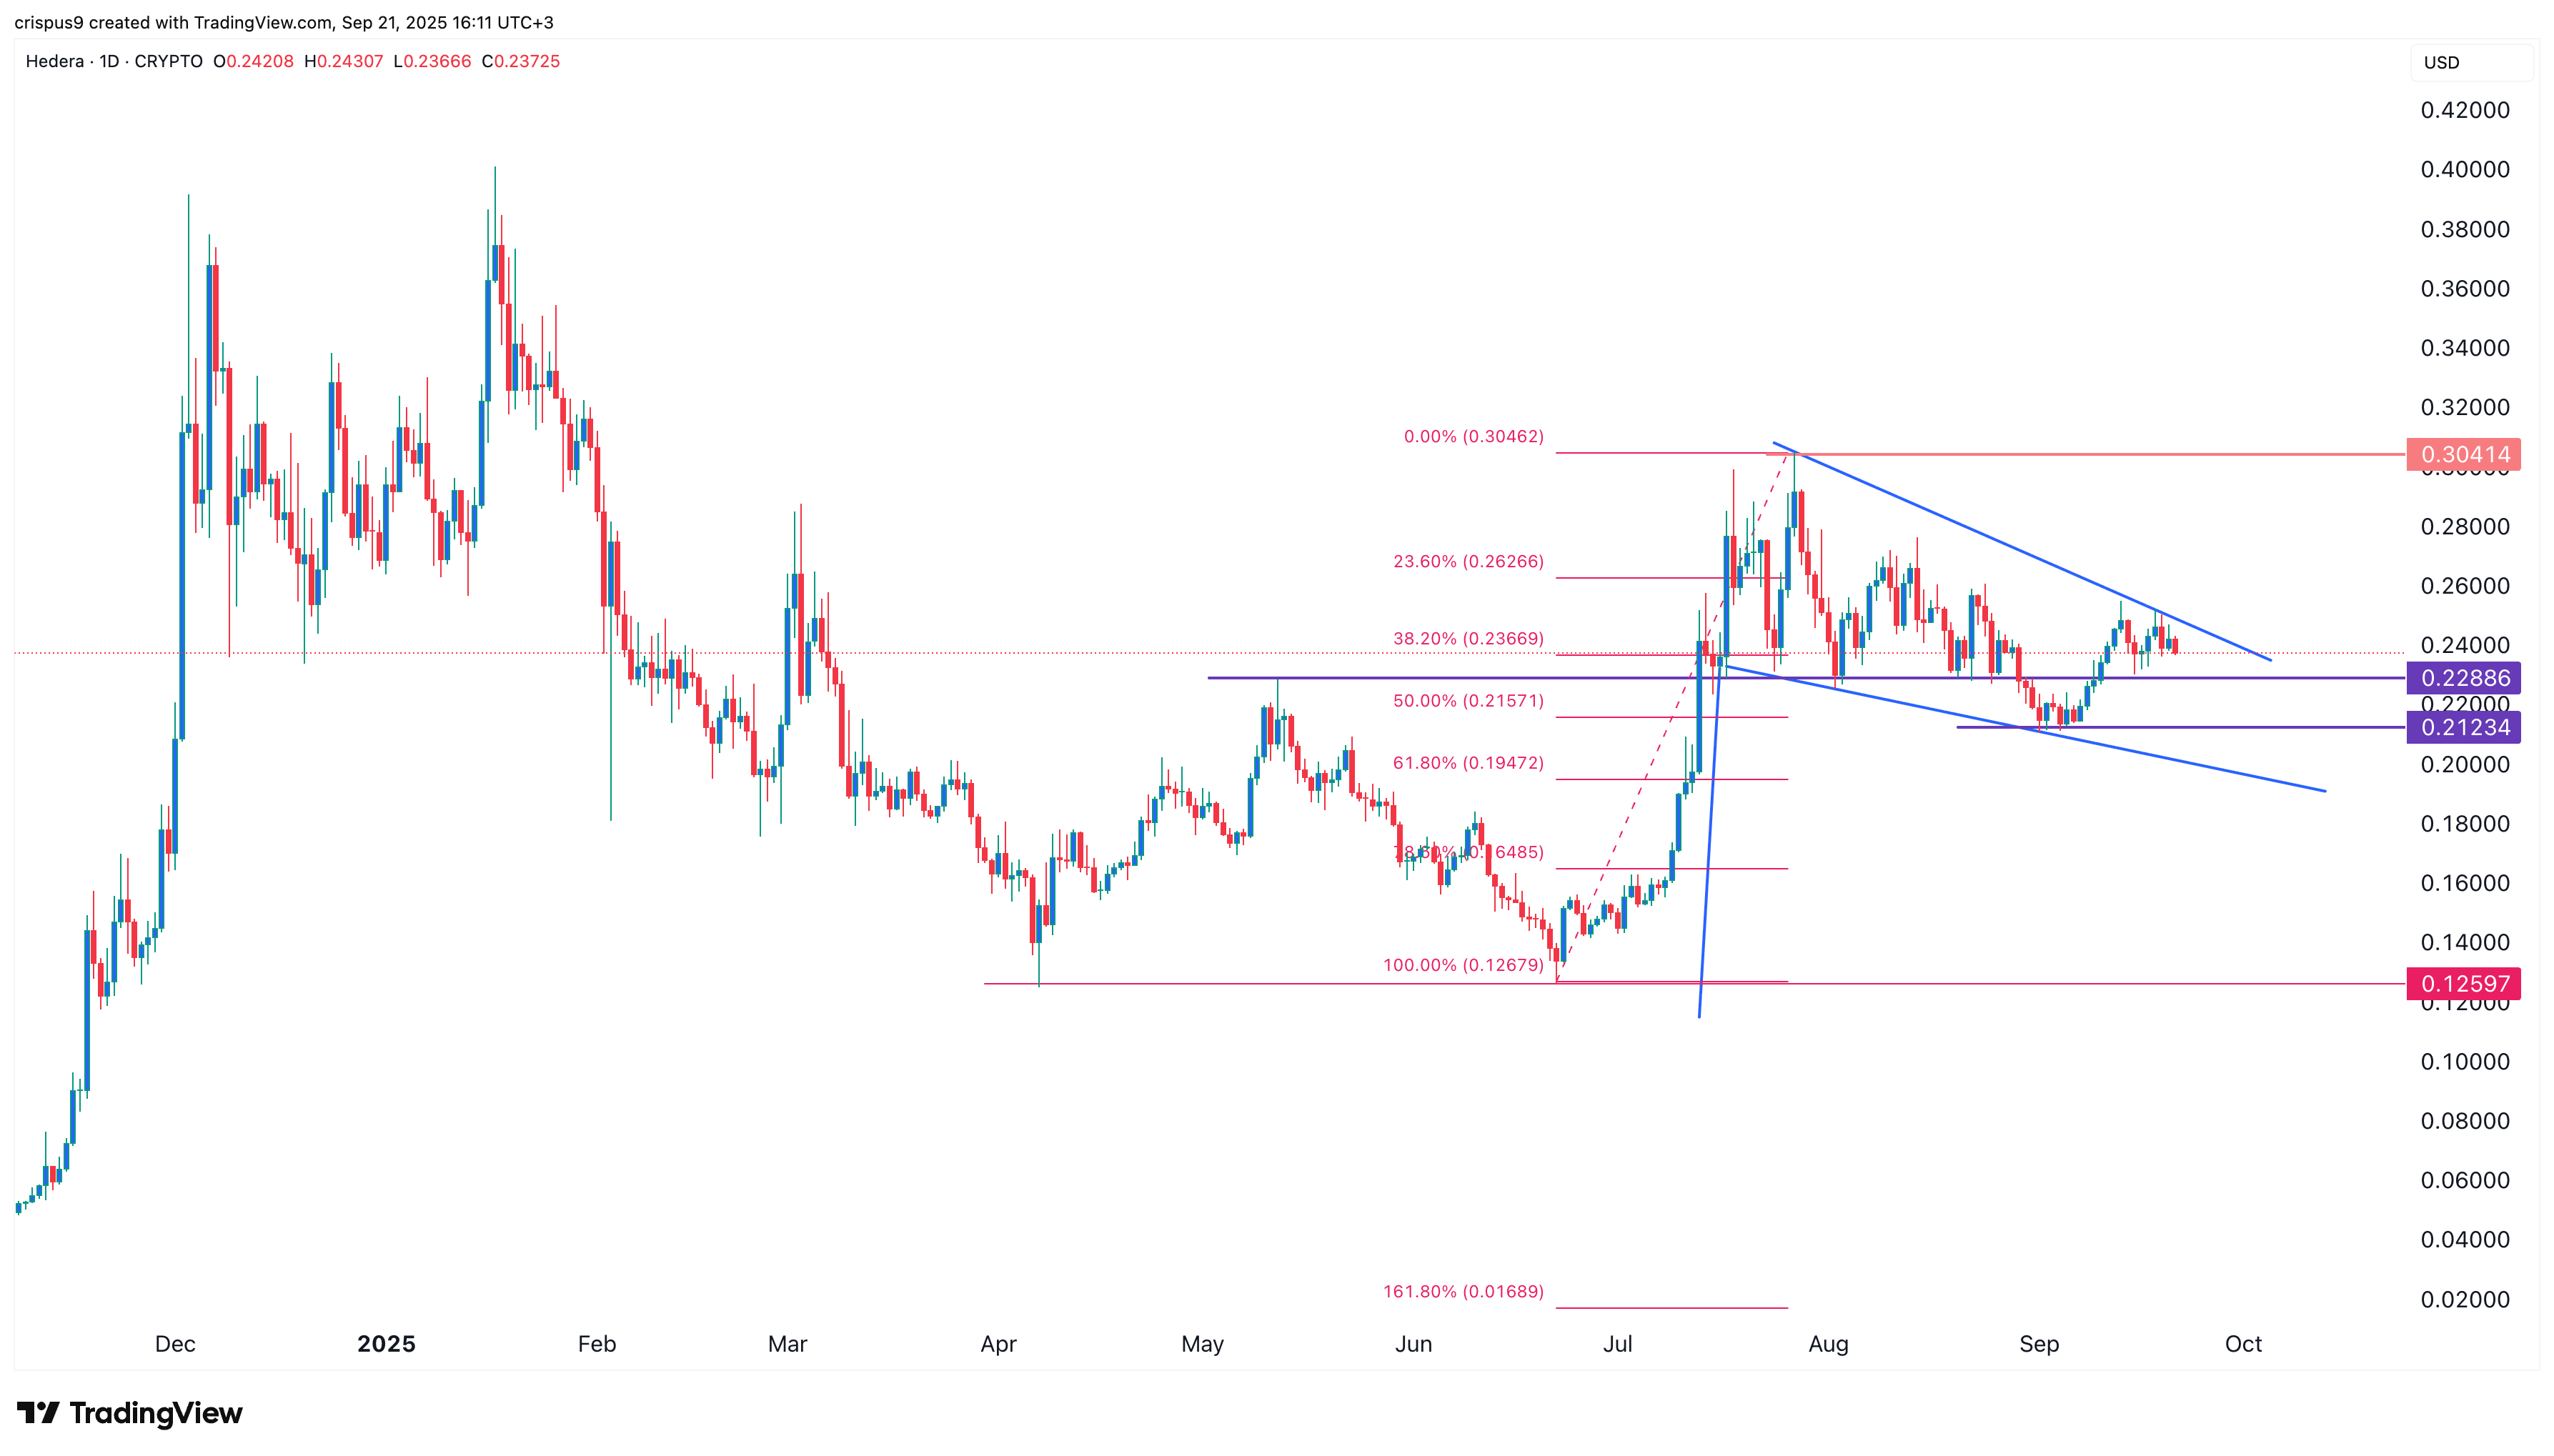
The daily timeframe chart shows that the $HBAR price formed a double-bottom pattern at $0.1260 and a neckline at $0.2288, its highest point on May 12.
Hedera price has retested that support, confirming a break-and-retest pattern, which is a sign of continuation. $HBAR has also formed a bullish flag pattern.
Most notably, there are signs that it is now in the second phase of the Elliot Wave. This phase is usually a corrective one, with the main characteristic being that it must not retrace 100% of the first one. Its lowest level coincided with the 61.8% retracement level.
Therefore, the most likely $HBAR price forecast is highly bullish, with the next target being at $0.3041, the highest point in July, which is about 28% from the current level.
