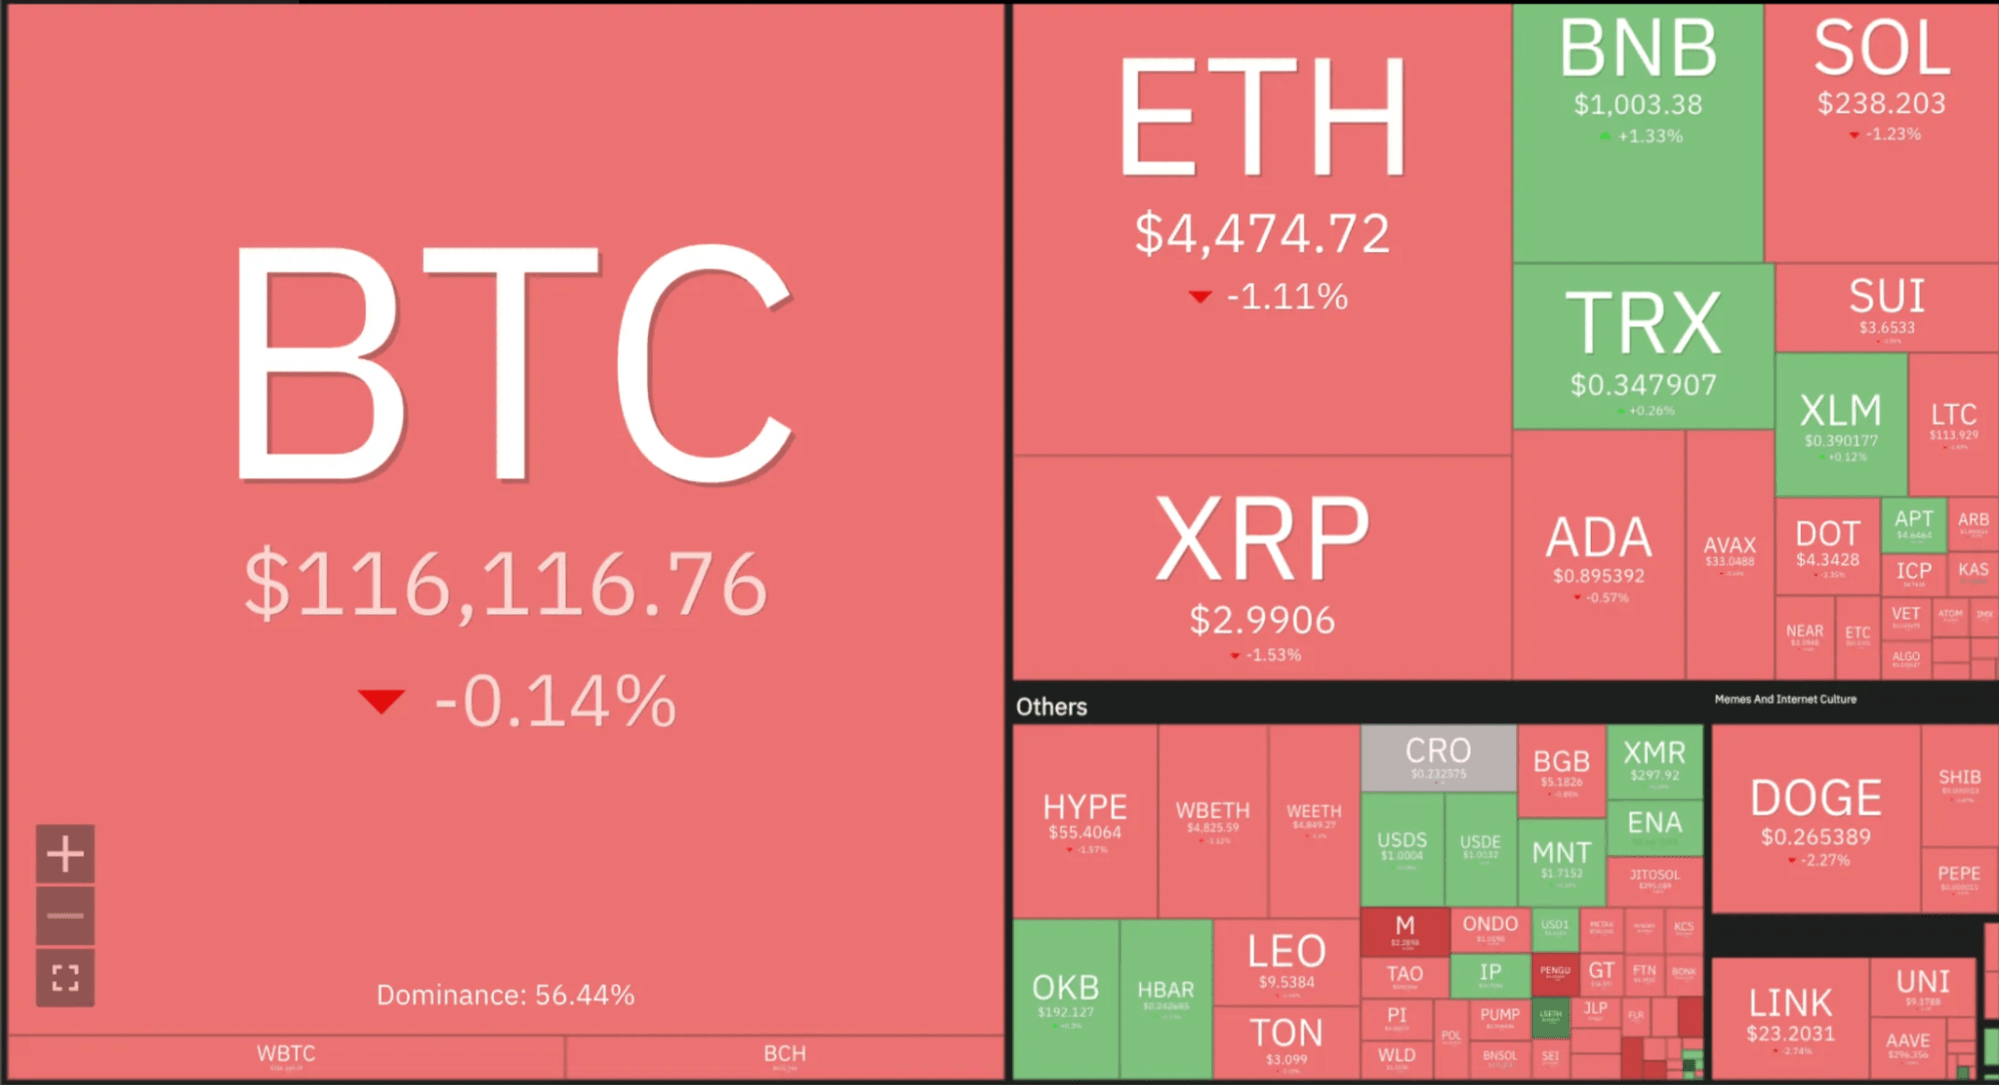
The cryptocurrency market has entered a decisive phase as Bitcoin (BTC), Ethereum (ETH), and Solana (SOL) show mixed signals following their late-August pullbacks. Bitcoin continues to face resistance around $117,500; however, bulls have done well to sustain the pressure as they push towards another all-time high retest. As of writing, Bitcoin trades at $116,860, with a 24-hour trading volume of approximately $22.4 billion, per Coingecko data.
Ethereum, on the other hand, has outperformed the broader crypto market in recent months, having gained about 5.4% in the past 14 days. While the broader trend remains constructive, each chart presents unique technical setups that could dictate the direction of the next leg.
Bitcoin (BTC) Price Analysis
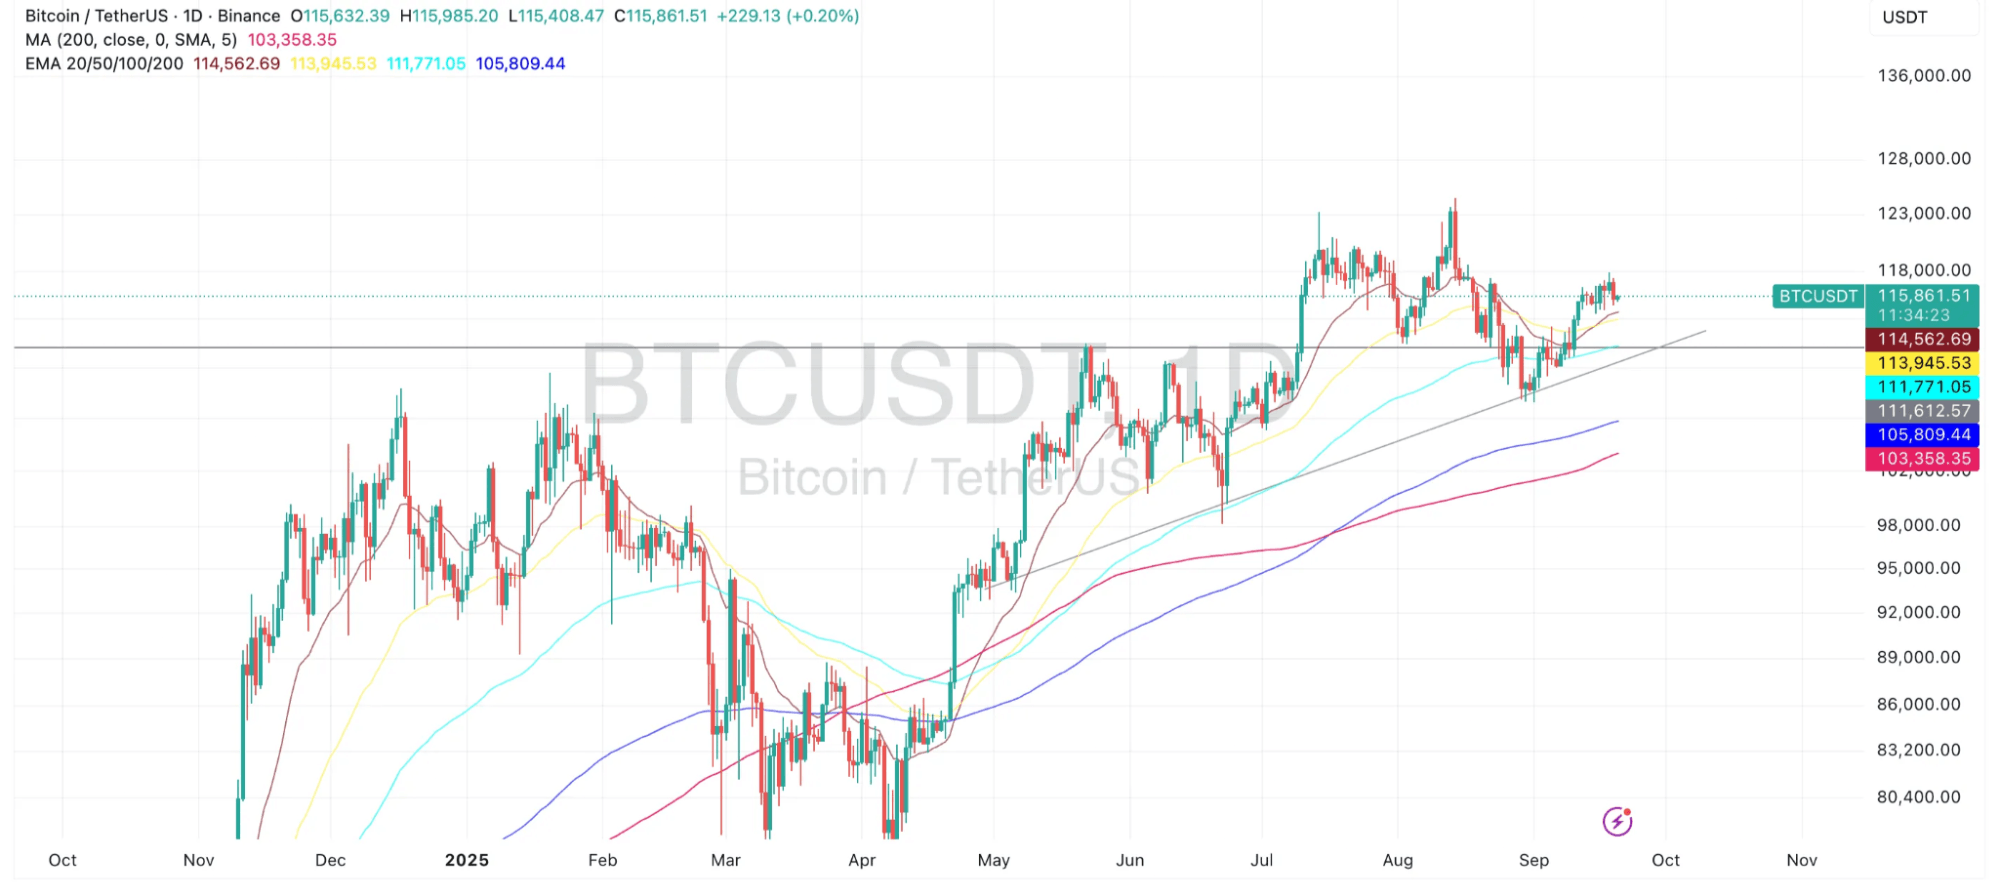
Bitcoin (BTC) has been trading around the $115,000–116,000 range after recovering from its early-September dip below $108,000. The price found support near $111,000, aligning with the 100-day EMA, and has since rebounded toward the $116,000 zone. The current structure shows BTC pressing against short-term resistance, while the longer-term moving averages (20, 50, 100, and 200-day) continue to slope upward—a sign of sustained bullish momentum.
-
Bullish Scenario: If BTC can hold above $114,500 and extend beyond $118,000, the door opens for a retest of the $123,000 region, last seen in July. Sustained strength above this level could confirm a continuation of the broader uptrend, with the next target zone around $128,000–130,000.
-
Bearish Scenario: On the downside, failure to hold above the $113,500–114,000 support cluster (coinciding with the 50-day EMA) could see BTC slide back toward $111,000 or even the 200-day MA near $103,000. A break of this longer-term support would flip the structure bearish, raising concerns of a deeper retracement toward $98,000.
At this stage, Bitcoin’s structure leans cautiously bullish, but the market remains sensitive to macro catalysts and liquidity conditions.
Ethereum (ETH) Price Analysis
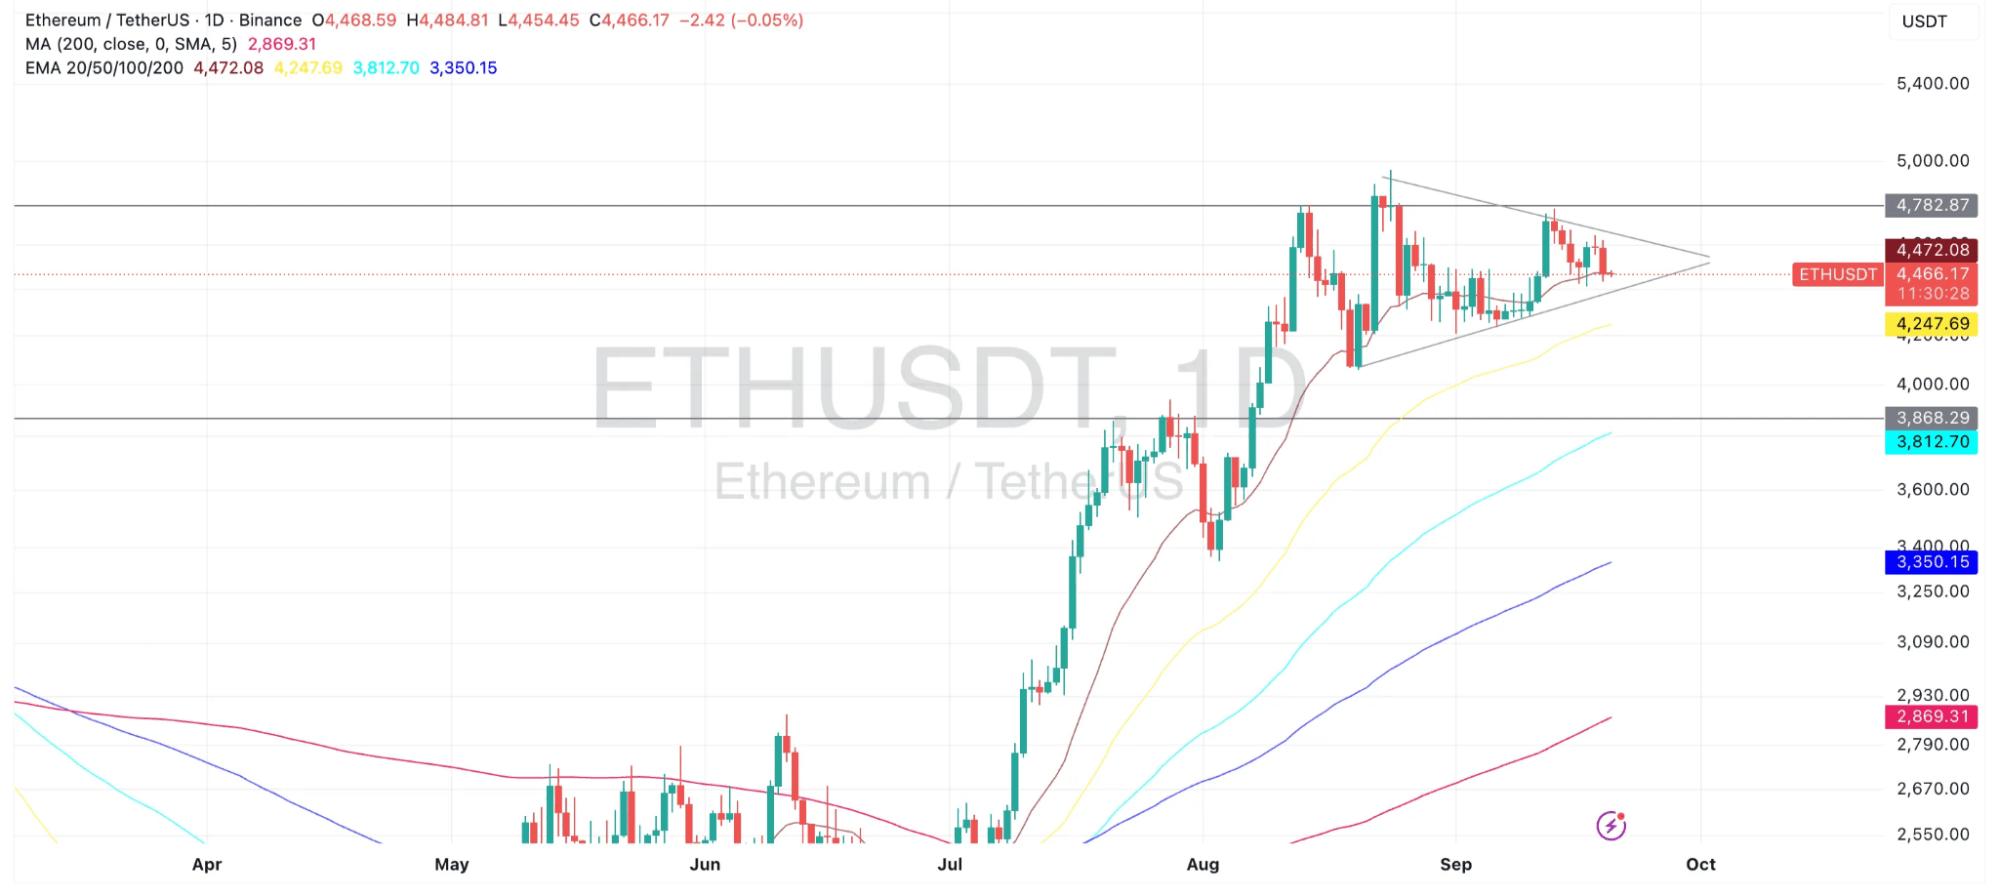
Ethereum’s price action is shaping into a symmetrical triangle formation, consolidating between $4,250 support and $4,780 resistance since late August. This tightening structure signals indecision, with bulls and bears preparing for a breakout. ETH has held firmly above its 50-day EMA near $4,247, which continues to act as a springboard.
-
Bullish Scenario: A clean break above $4,780 would confirm the triangle breakout, paving the way for ETH to test $5,000 and potentially stretch toward $5,200–5,400. Volume expansion will be key to validating such a move.
-
Bearish Scenario: Conversely, a rejection from the upper boundary followed by a breakdown below $4,250 could drag ETH back to the $4,000–3,900 zone, where the 100-day EMA sits as backup support. A decisive loss of this level could expose ETH to deeper retracement toward $3,500.
In the near term, Ethereum’s consolidation suggests a breakout is imminent. Traders will be closely watching for confirmation in either direction.
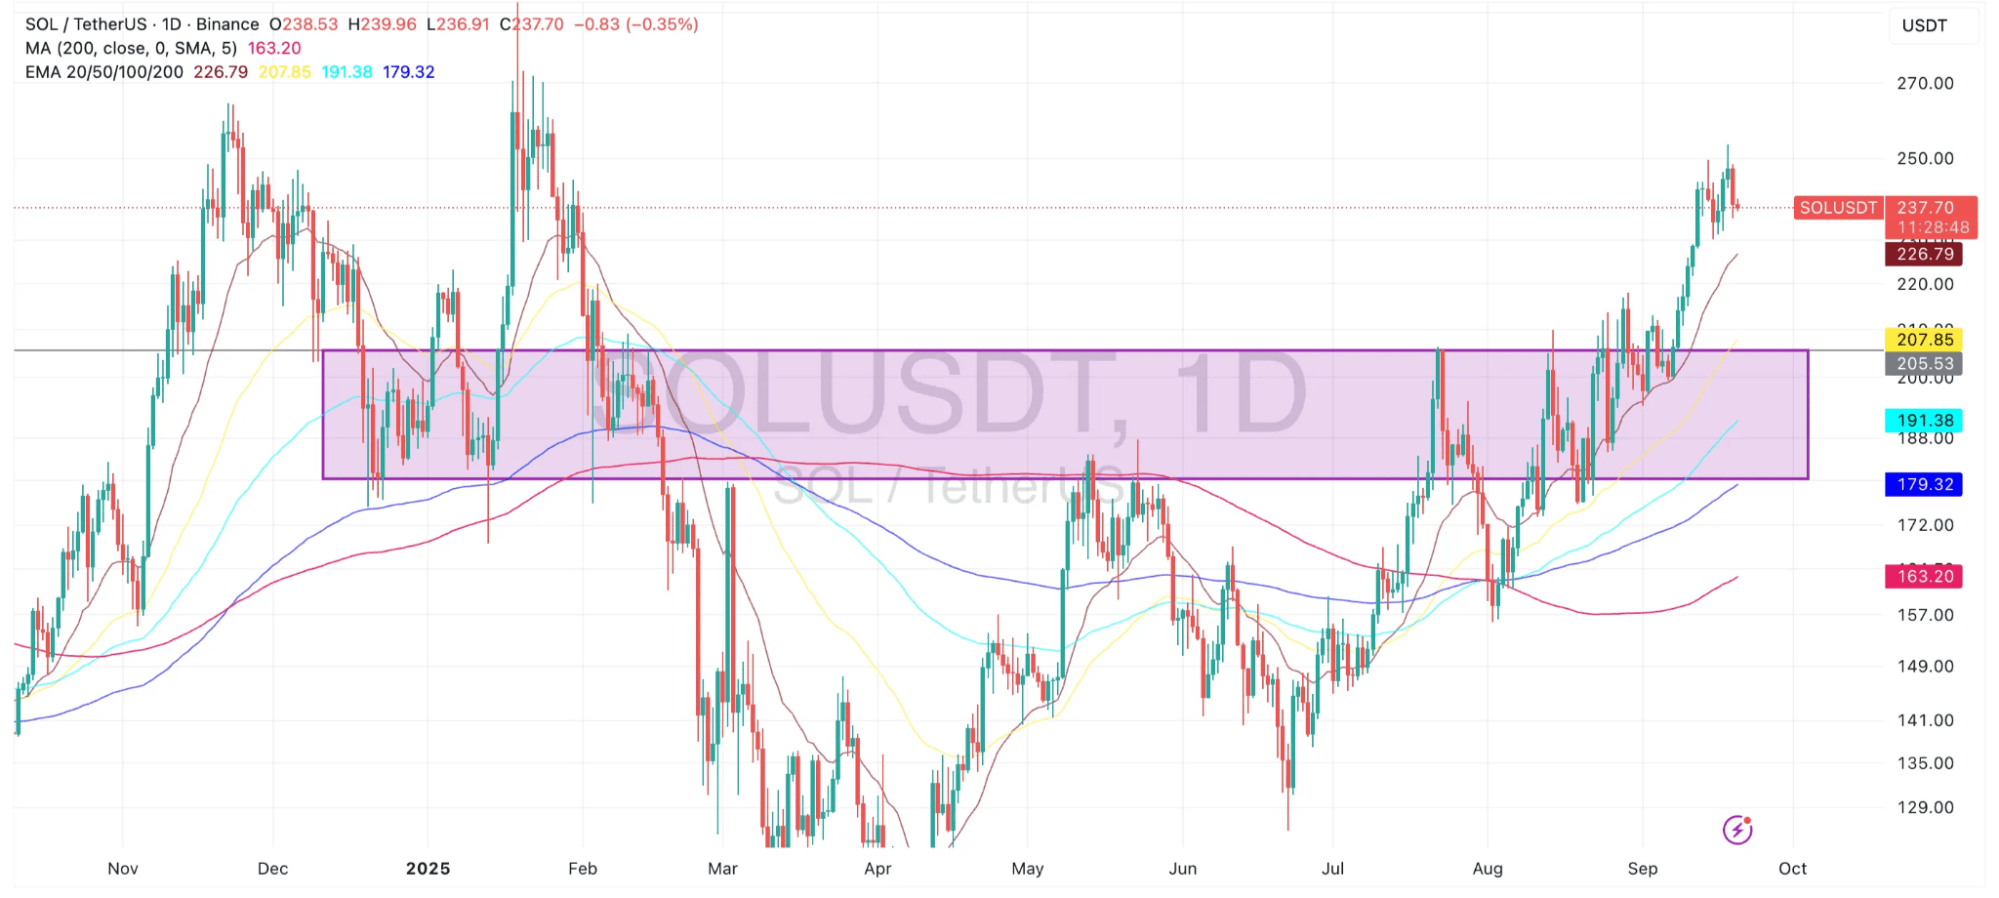
Solana (SOL) Price Analysis
Solana has been one of the stronger performers, breaking out of a prolonged consolidation zone between $170 and $205 in late August. The breakout carried SOL as high as $239, where the token is now consolidating after a sharp run. Importantly, the breakout above the $205 ceiling marked a shift in market structure, turning previous resistance into a new support base.
-
Bullish Scenario: If SOL holds above $225–227 and builds momentum, the next upside targets sit near $250 and $265. A successful retest of the breakout zone could confirm the strength of this bullish leg, keeping SOL among the stronger altcoins in September.
-
Bearish Scenario: A failure to sustain above $227 could see SOL retreat toward the breakout zone at $205. Losing this critical level would suggest a false breakout, raising risks of a slide back toward the 200-day MA around $163.
For now, Solana’s chart shows resilience, but after a strong rally, profit-taking pressure may increase unless buyers step in aggressively.
Market Outlook
As September unfolds, Bitcoin, Ethereum, and Solana remain in technically constructive positions but face key resistance levels. BTC is grinding just below $118,000, ETH is at the apex of a triangle awaiting breakout, and SOL is testing post-breakout momentum.
The bull case hinges on Bitcoin maintaining its support base and dragging the broader market higher, with ETH confirming an upside breakout and SOL extending beyond $250. Conversely, the bear case would be triggered if BTC falters under $114,000, ETH breaks its triangle to the downside, or SOL loses the $205 breakout level.
For now, the charts suggest cautious optimism, with bulls retaining an edge but requiring confirmation in the coming sessions. Traders should remain alert to volatility spikes as these major cryptocurrencies test critical technical levels.