

 20
20
- Bitcoin Cash trades in the green on Thursday after setting a new yearly high in the previous session.
- Derivatives and on-chain data signal bullish momentum, with Open Interest climbing and a buy-dominant phase emerging.
- Technical outlook supports a rally continuation, with targets set beyond the $700 mark.
Bitcoin Cash ($BCH) is trading above $621 at the time of writing on Thursday after hitting a new yearly high, fueled by Bitcoin ($BTC) surge to an all-time high. The bullish momentum continues to strengthen, driven by rising Open Interest and a buy-dominant phase. The technical outlook suggests rally continuation with bulls targeting levels beyond $700.
Bitcoin Cash on-chain and derivatives data show bullish bias
CryptoQuant data, as shown in the graph below, highlights buying pressure on Bitcoin Cash. The Futures Taker CVD (Cumulative Volume Delta) for $BCH has flipped positive on Sunday and has been constantly increasing so far this week. This metric measures the cumulative difference between market buy and sell volumes over 3 months. When the 90-day CVD is positive and increasing, it suggests the Taker Buy Dominant Phase, while a negative and decreasing value indicates the Taker Sell Dominant Phase.
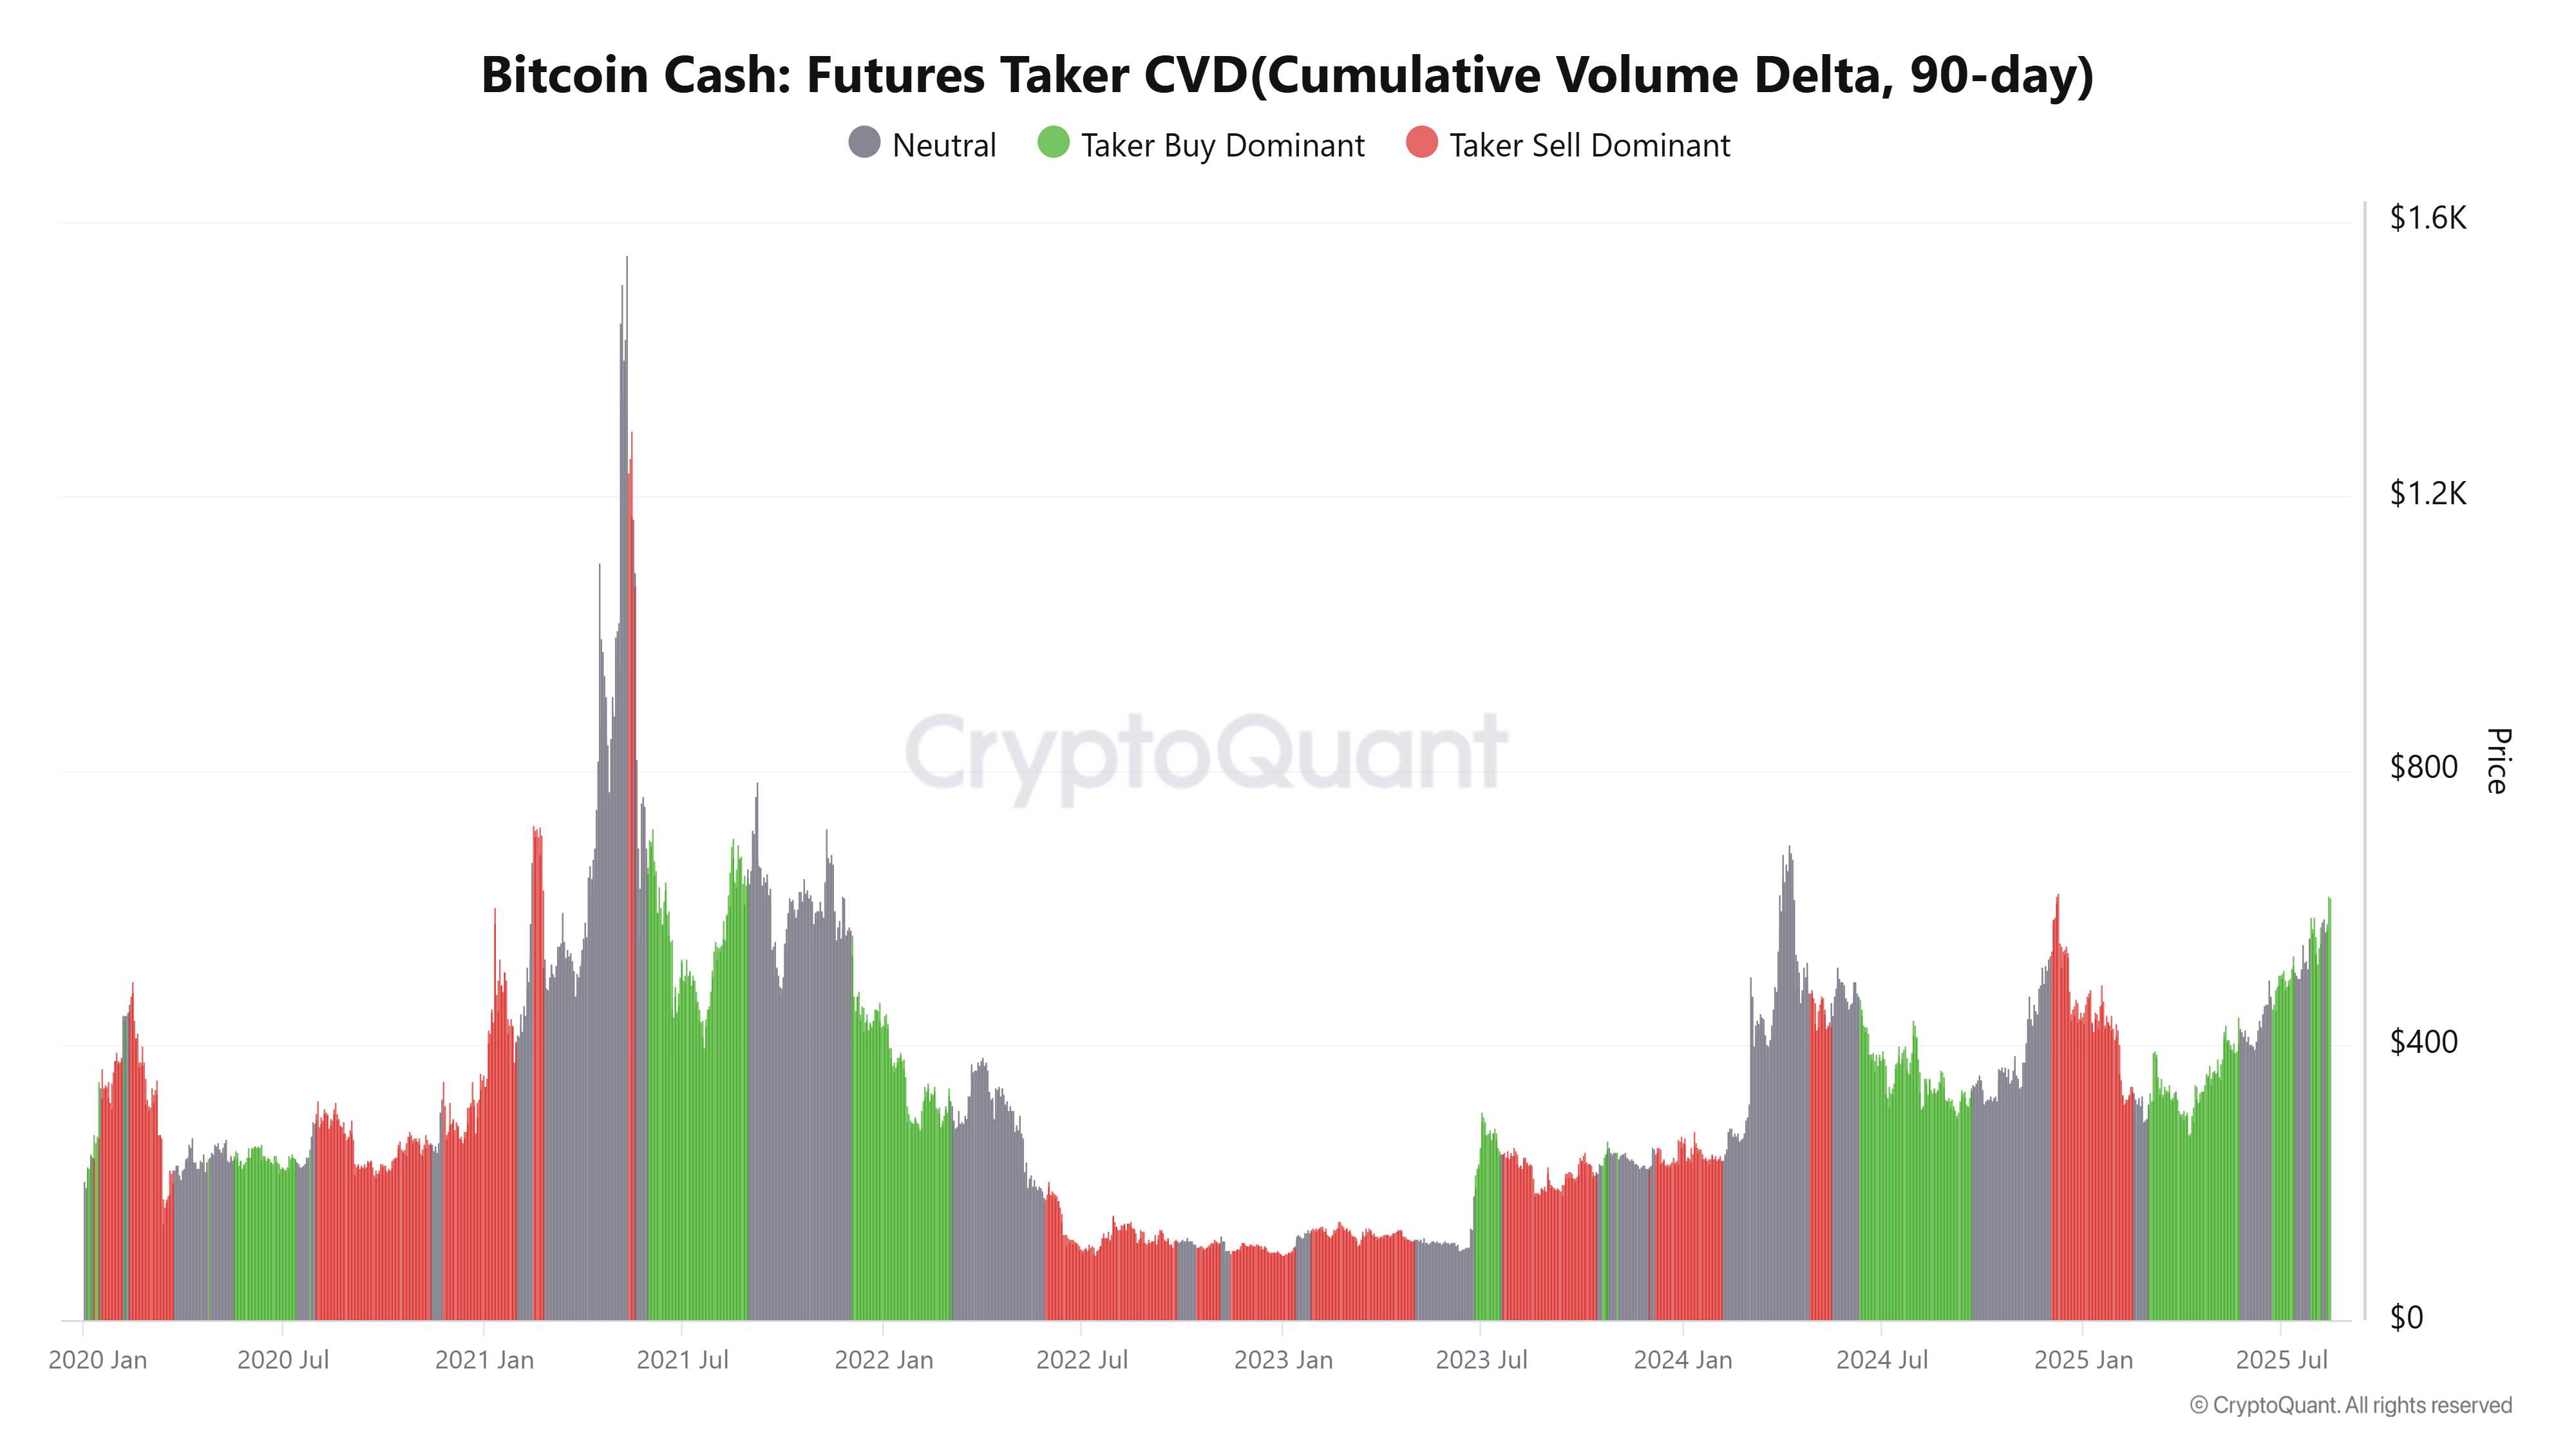
$BCH Futures Taker CVD chart. Source: CryptoQuant
Adding to this optimism, CoinGlass’ data shows that the futures OI in Bitcoin Cash at exchanges reached the highest yearly level of $683.96 million on Wednesday, levels not seen since April 10, 2024. Rising OI represents new or additional money entering the market and new buying, which could fuel the current $BCH price rally.
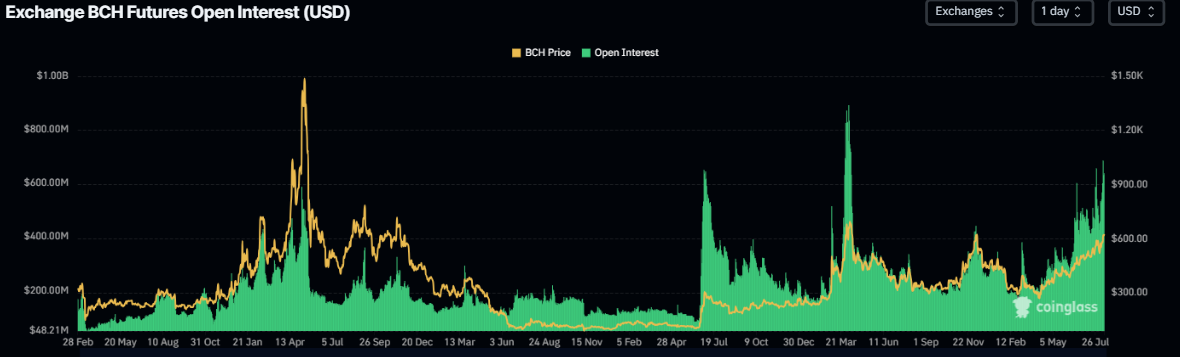
Bitcoin Cash Open Interest chart. Source: CoinGlass
Bitcoin Cash Price Forecast: Bulls aiming for levels beyond $700
Bitcoin Cash price reached a new yearly high of $634.3 on Wednesday, having rallied over 9% so far this week. At the time of writing on Thursday, it trades around $622, nearing its key resistance at $640.
If $BCH continues its upward trend and closes above the $640 level on a daily basis, it could extend the gains toward its next resistance level at $719.5.
The Relative Strength Index (RSI) on the daily chart reads 64, above the neutral value of 50 and points upward, indicating bullish momentum. The Moving Average Convergence Divergence (MACD) showed a bullish crossover on Tuesday, generating buy signals and also showed rising green histogram bars above its neutral level, further supporting the bullish thesis.
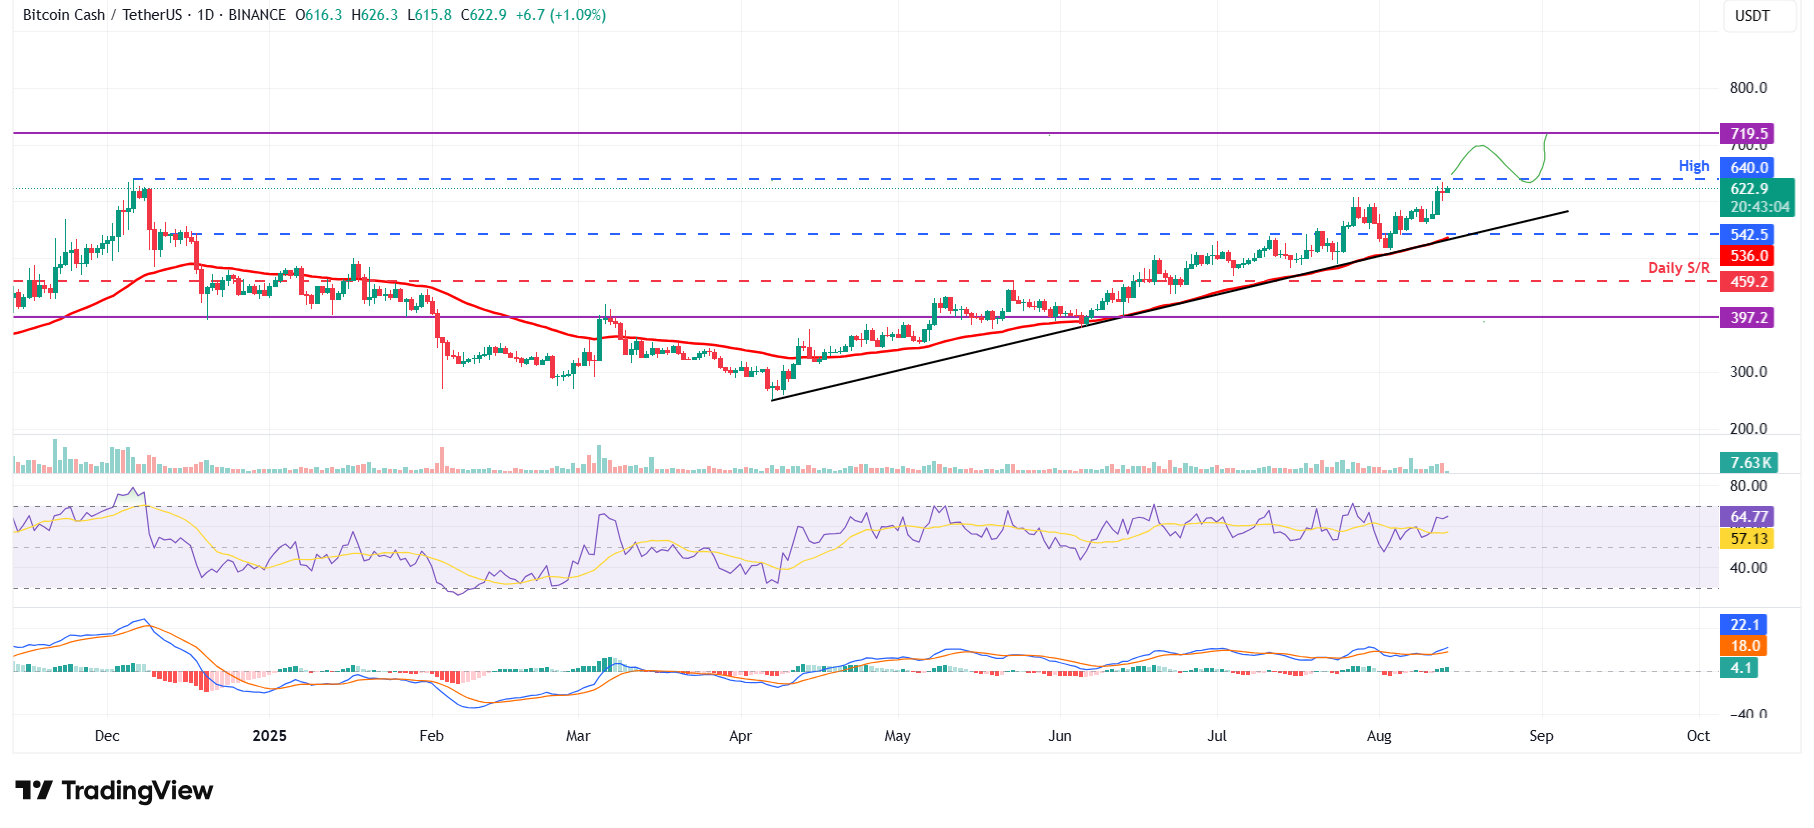
$BCH/USDT daily chart
However, if $BCH faces a correction, it could extend the decline to retest its daily support at $542.5.
Related news
- Bitcoin reaches new all-time high after soft CPI boosts rate cut bets
- Top 3 Price Prediction: Bitcoin, Ethereum, Ripple – $BTC and XRP stabilize, ETH nears all-time high
- Cardano Price Forecast: ADA bulls eye next leg higher as Open Interest climbs to $1.44 billion