Why Did Solana Price Crash?
Solana's strong run in July—fueled by ETF rumors—ran out of steam. Without confirmation, and following the Fed's decision to pause rate changes, SOL saw a wave of selling. Combined with Bitcoin’s decline, Solana lost over 6.6% on the week and broke below $165.
SOL Coin Chart Breakdown
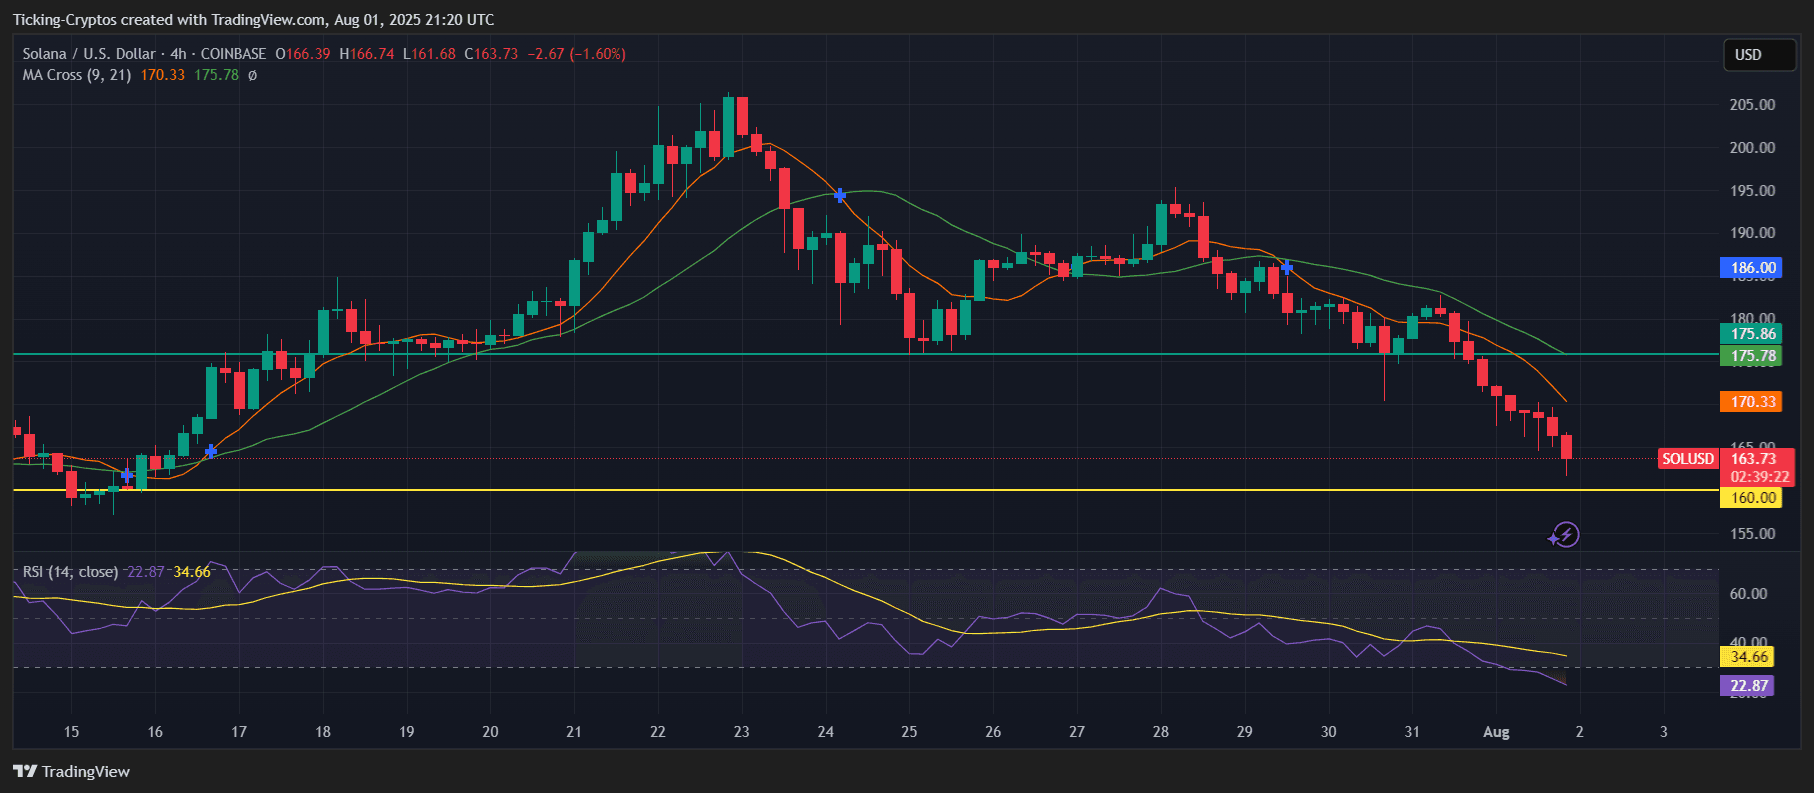
SOL/USD 4-hours chart - TradingView
- SOL broke $175.8 and $170 support, now trading near $163.73
- Next critical level: $160, psychological and technical
- RSI is deeply oversold at 22.87, flashing bounce potential
- 9 and 21 EMAs are clearly trending lower → full downtrend confirmation
What to Watch Next for SOL
- If $160 fails, expect a move toward $150 or even $142.
- Bulls must reclaim $170, then $175.80 to regain structure.
- A short-term bounce is likely due to oversold RSI, but it may be short-lived without macro improvement.
Watch if volume spikes on dips – this could signal smart money accumulation.