


 31
31
Internet Computer Protocol’s native token $ICP has been locked in a sideways consolidation pattern for several months. A recent breakdown from this range has put the cryptocurrency on a downward trajectory, though some key support levels could provide a bounce. The token has dropped by 2.7% in the past 24 hours, with over 11.3% drop recorded in the last two weeks alone.
As of writing, $ICP trades at $5.00, with a market capitalization of approximately $2.7 million, and $74.5 million in trading volume over 24 hours, per Coingecko. In this analysis, we examine the $ICP price action, potentially providing reasonable trading insights for interested readers.
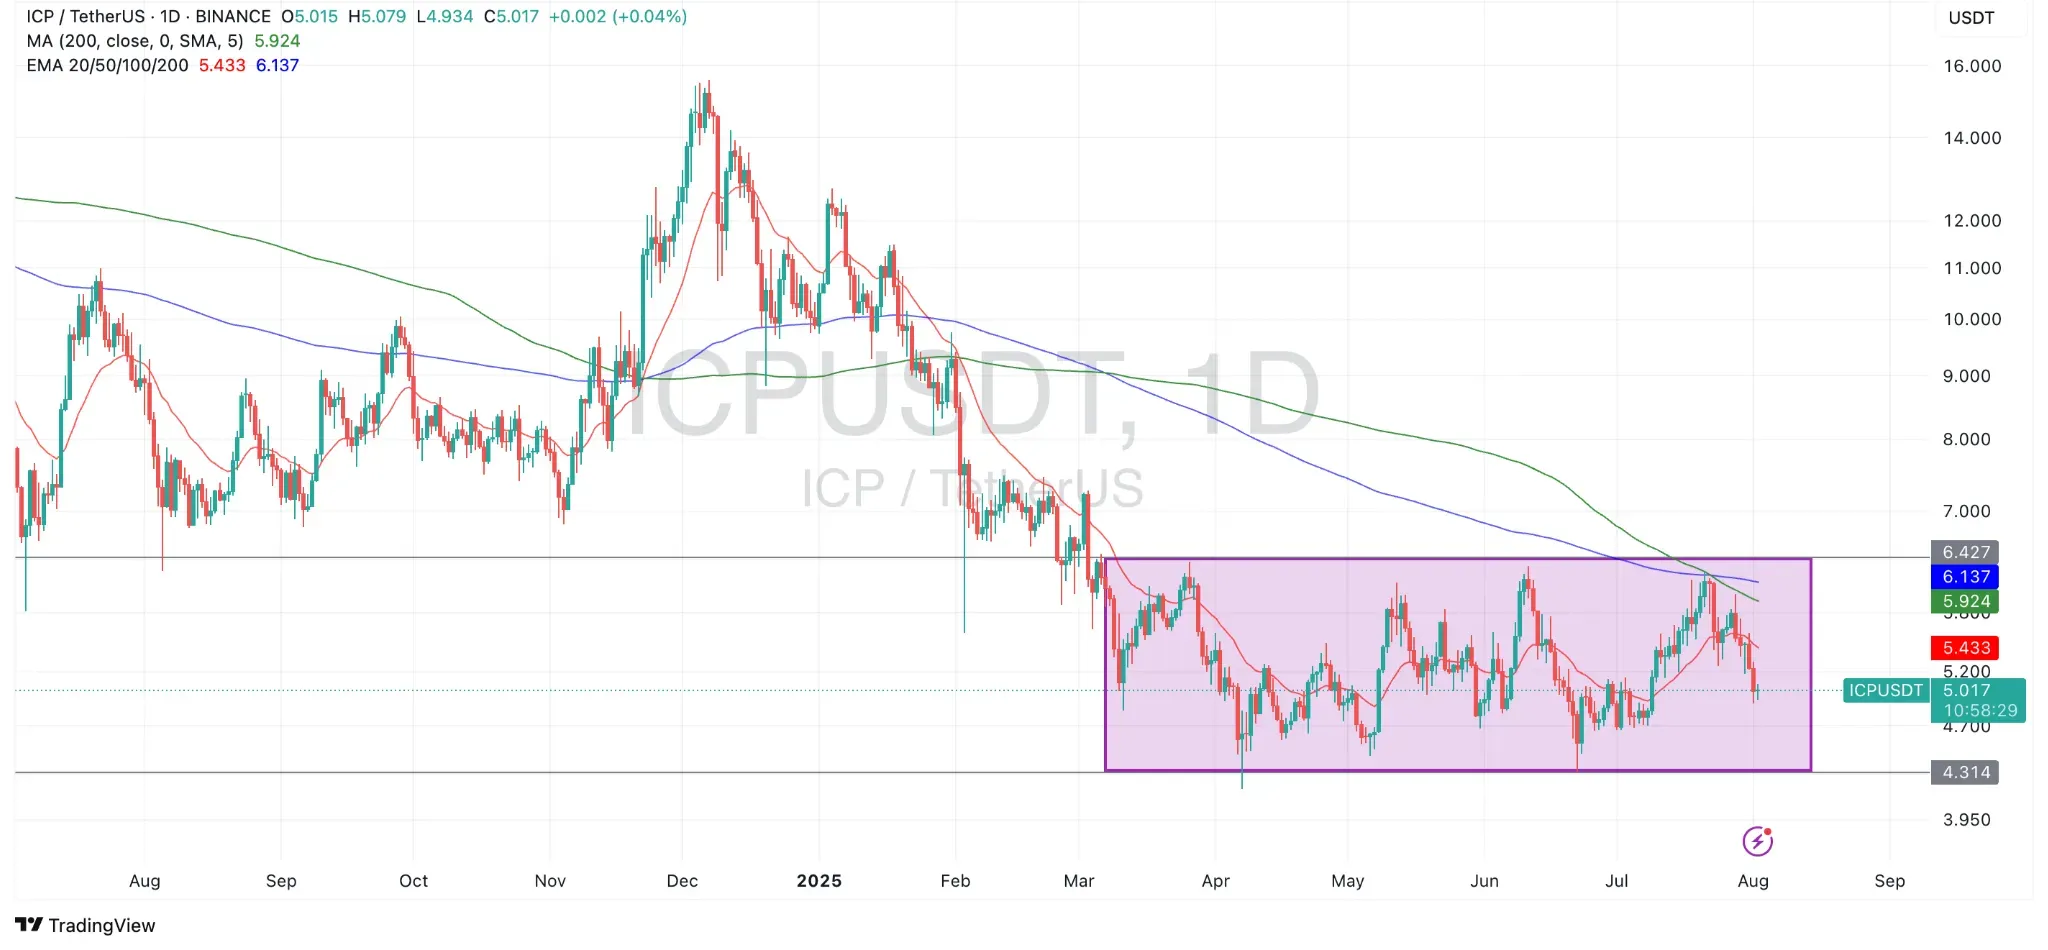 $ICP/$USDT Price chart from TradingView">
Overall Context: The Range
Since early March 2025, $ICP has been trading within a well-defined horizontal range, with resistance around $6.40 and support near $4.30. This six-months-long period of consolidation has seen multiple tests of both the upper and lower boundaries, validating them as key levels. The chart clearly shows the price moving sideways within the purple-highlighted box, indicating a lack of clear trend and a battle between bulls and bears for control.
The period from July to date has been particularly significant. After a strong bounce off the $4.30 support in late June, $ICP rallied back towards the top of its range, reaching as high as $6.25 in mid-July. However, bulls were unable to push the price higher as price settled just below the 200-day EMA (~$6.14) and SMA (~$5.92). This marked the third rejection from this key resistance level since March, signaling a strong supply zone.
Following this rejection, the price began a steady decline. The daily candles show a clear series of lower highs and lower lows, indicating that bears have gained momentum. The price has now broken below the moving averages and has dipped below the mid-point of the long-term range.
Bullish Scenario:
Bounce from Support: The primary hope for bulls lies in a potential bounce from the long-term support at $4.30. If the price can stabilize and form a bottom around this level, it would present a low-risk entry point. A strong rebound from here would signal that the long-term range is still holding, and a rally back towards the $6.40 resistance could be on the cards. However, bullish traders would be hoping the $4.70–$5.00 supports holds, as it would be a stronger indication of seller exhaustion.
Regaining Moving Averages: A more aggressive bullish move would involve the price reclaiming the $5.40 level and the moving averages. A strong daily close above the 20-period EMA would be an early signal that the short-term trend is reversing. Additionally, a confirmed breakout above the range high ($6.42) would invalidate the consolidation structure and signal a potential trend reversal. Immediate upside targets would lie near $7.50 and $8.80, aligned with prior breakdown levels from March.
Traders should look out for a reclaim of the 200-day EMA on volume, combined with RSI bullish divergence or a golden cross on shorter EMAs (which appears to be forming).
Bearish Scenario:
Range Breakdown: The most significant risk for bulls is a definitive breakdown of the long-term range. If the price breaks and closes below the $4.30 support level, it would signal a major shift in market dynamics. This would likely trigger a wave of selling, potentially leading to a sharp decline towards the next psychological support level, which could be as low as the $3.90 area.
Moving Average Resistance: The moving averages, particularly the 20-period EMA at $5.43, are now acting as key resistance levels. A failure to move above these levels on any short-term rallies would confirm the bearish momentum and suggest that further downside is likely. Even if price breaks above the 20-day EMA, failure to reclaim the 50/200-day EMAs will certainly reinforce bearish sentiment.
Conclusion
Ranges are one of the most exciting trading patterns for experienced traders as they’re often more predictable. At the moment, the rejection at the top of the long-term range, coupled with the breakdown of key moving averages, indicates that sellers are currently in control. The immediate focus for $ICP traders will be on the critical support level at $4.30, should the $5.00 level fail to hold. A break below the range lows would confirm a more significant bearish trend and open the door for a deeper decline.
