


 18
18
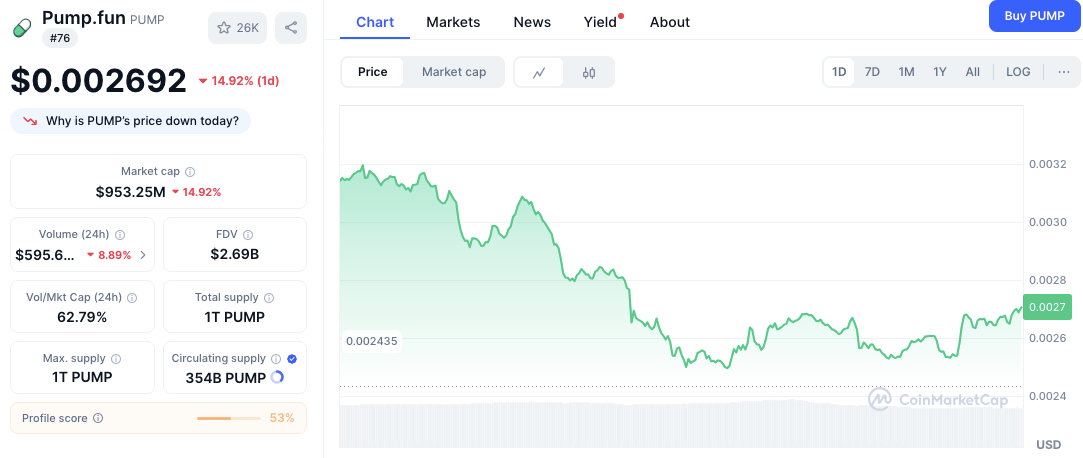
The Pump.fun ($PUMP) token witnessed a sharp 15% downturn over the last 24 hours as intensifying selling pressure and millions in liquidations pushed the asset to a critical technical juncture.
After falling to a daily low of $0.002435, the token is attempting a mild recovery, hovering around $0.002690 at press time.
Long Liquidations Fuel the Downturn
The sharp price drop was amplified by a significant volume of liquidations in the perpetual contracts market. Over the last 24 hours, $PUMP saw $7.3 million in total liquidations, according to data from Coinanalyze.
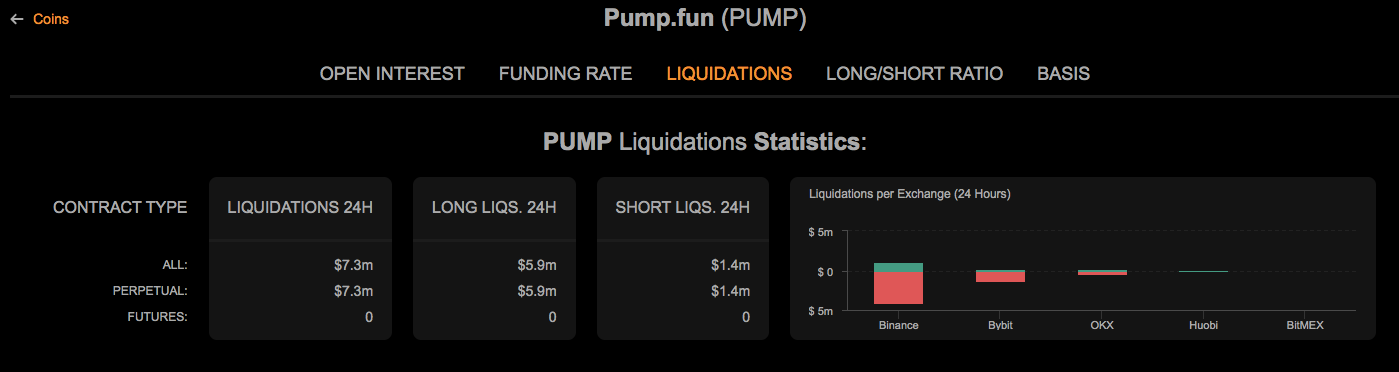
Notably, the vast majority of these, $5.9 million, were from long positions, indicating that traders betting on a price increase were caught off-guard and forcefully sold off.
Significantly, Binance led all exchanges in liquidation volume, followed by Bybit, OKX, Huobi, and BitMEX. This concentration of activity reflects how speculative interest is driving short-term volatility.
Key $PUMP Price Levels to Watch
From a technical standpoint, $PUMP is now testing a crucial support zone. Despite the drop, technical levels indicate potential stabilization.
The immediate support lies near $0.002435, which was also the day’s low. A second layer of support sits at $0.002500, a level that previously attracted dip-buying activity. These price floors may encourage accumulation if sentiment improves.
On the flip side, the token is facing overhead resistance near $0.002800, where it recently failed to sustain gains. A breakout beyond $0.002800 could trigger momentum buying.
Related: Pump.fun ($PUMP) Price Prediction for August 2025
However, a larger hurdle looms at $0.003200, a level previously rejected by sellers during a price rally. Any movement toward this level would require renewed bullish interest.
Momentum Indicators Signal Caution and Opportunity
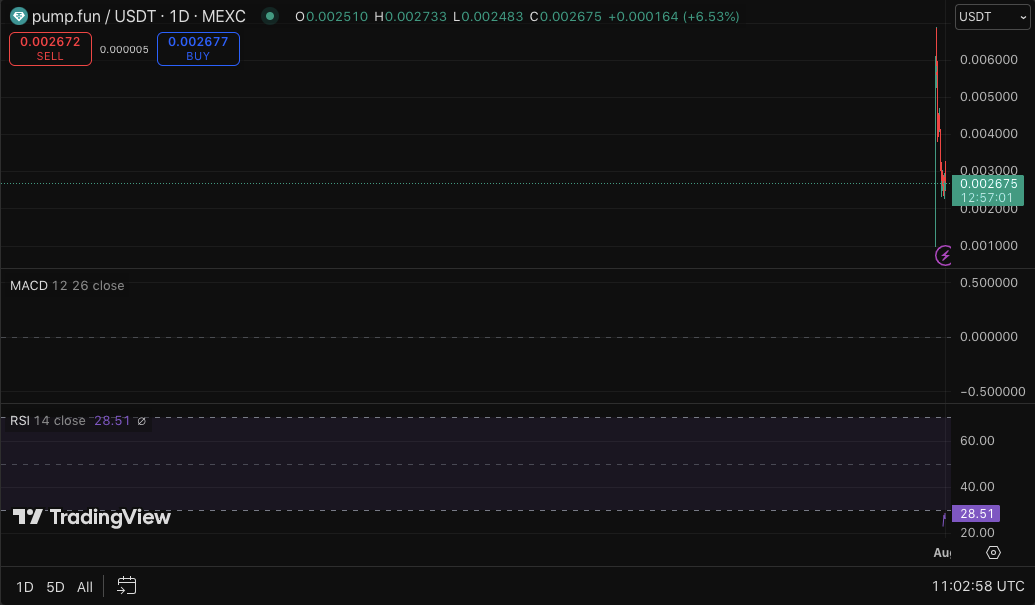
From a trend perspective, the one-day chart reveals a predominantly downward pattern. A minor bounce later in the day hints at possible bottoming. The Relative Strength Index (RSI) now reads 28.51 firmly in oversold territory. This level typically reflects overextended selling and could precede a technical rebound.
Related: Pump.fun’s Daily Revenue Plunges Below $300k, Lowest Since September 2024
However, the Moving Average Convergence Divergence (MACD) remains bearish. The MACD line sits below the zero line, while the histogram continues to show negative momentum. Buyers may need more time before a convincing reversal forms.
Disclaimer: The information presented in this article is for informational and educational purposes only. The article does not constitute financial advice or advice of any kind. Coin Edition is not responsible for any losses incurred as a result of the utilization of content, products, or services mentioned. Readers are advised to exercise caution before taking any action related to the company.
