After a sharp rally through July, XRP price is back under pressure as sellers regain short-term control. XRP price today trades around $2.95, sliding from its recent peak near $3.66. The correction comes amid weakening momentum across multiple indicators and broader questions surrounding XRP Ledger utility in institutional payments.
What’s Happening With XRP’s Price?
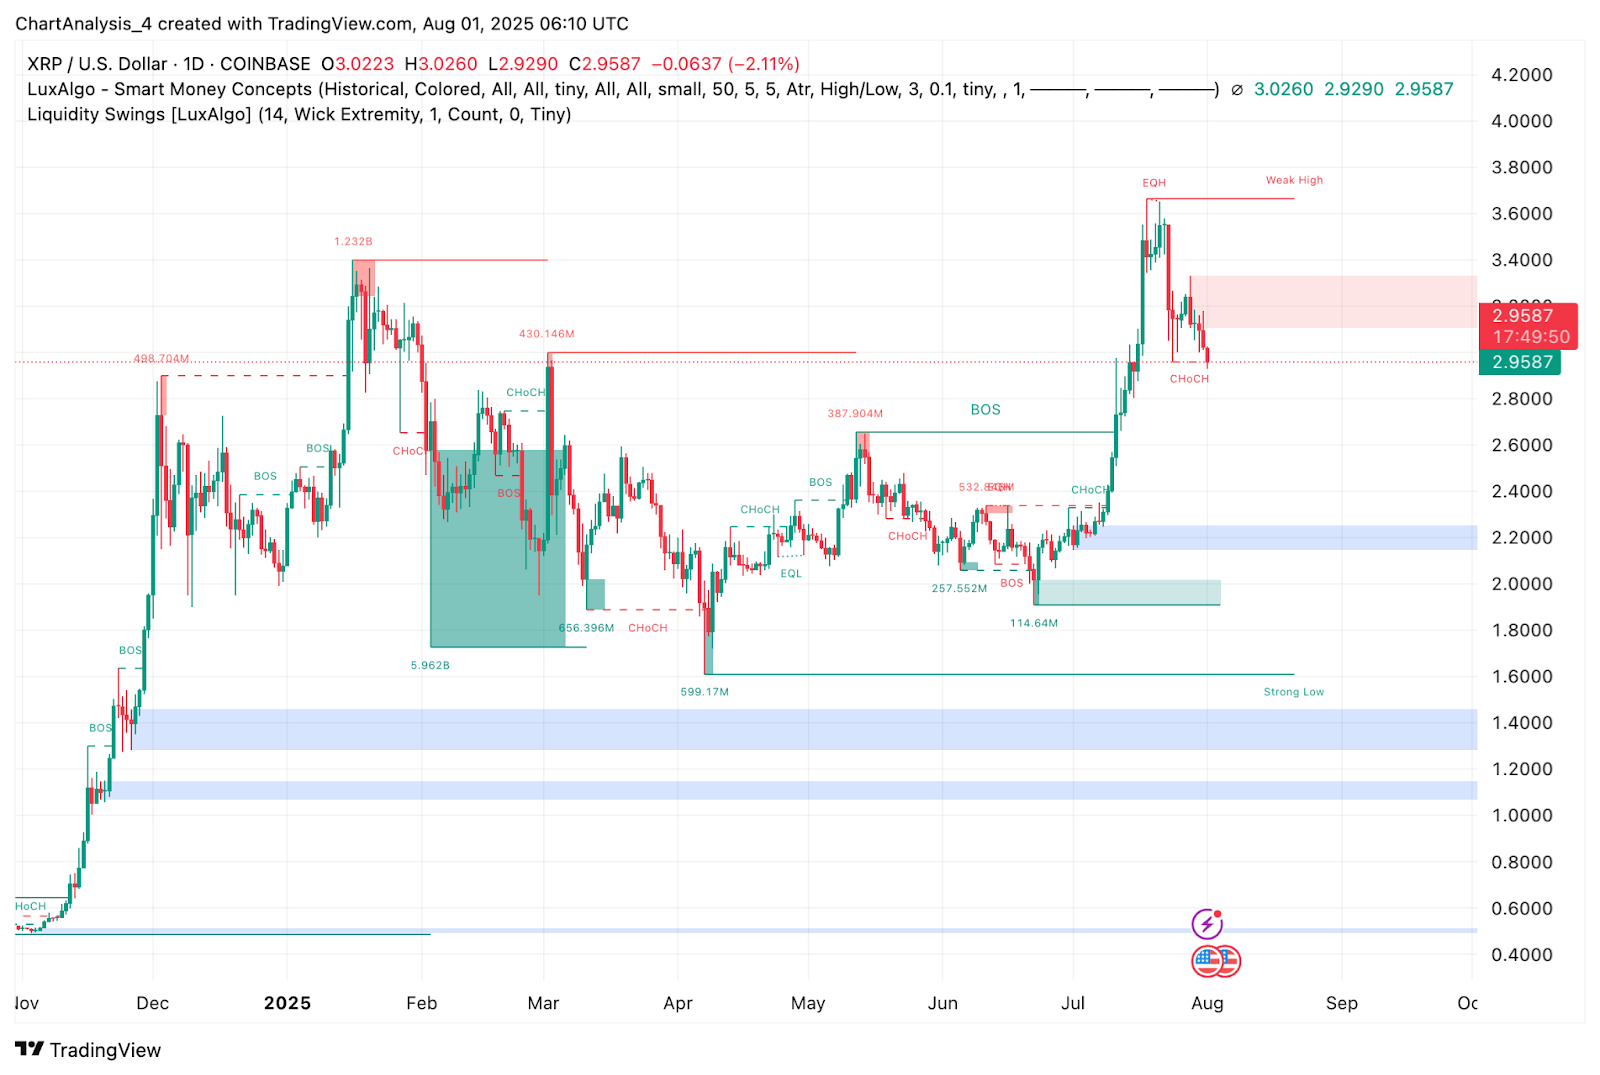
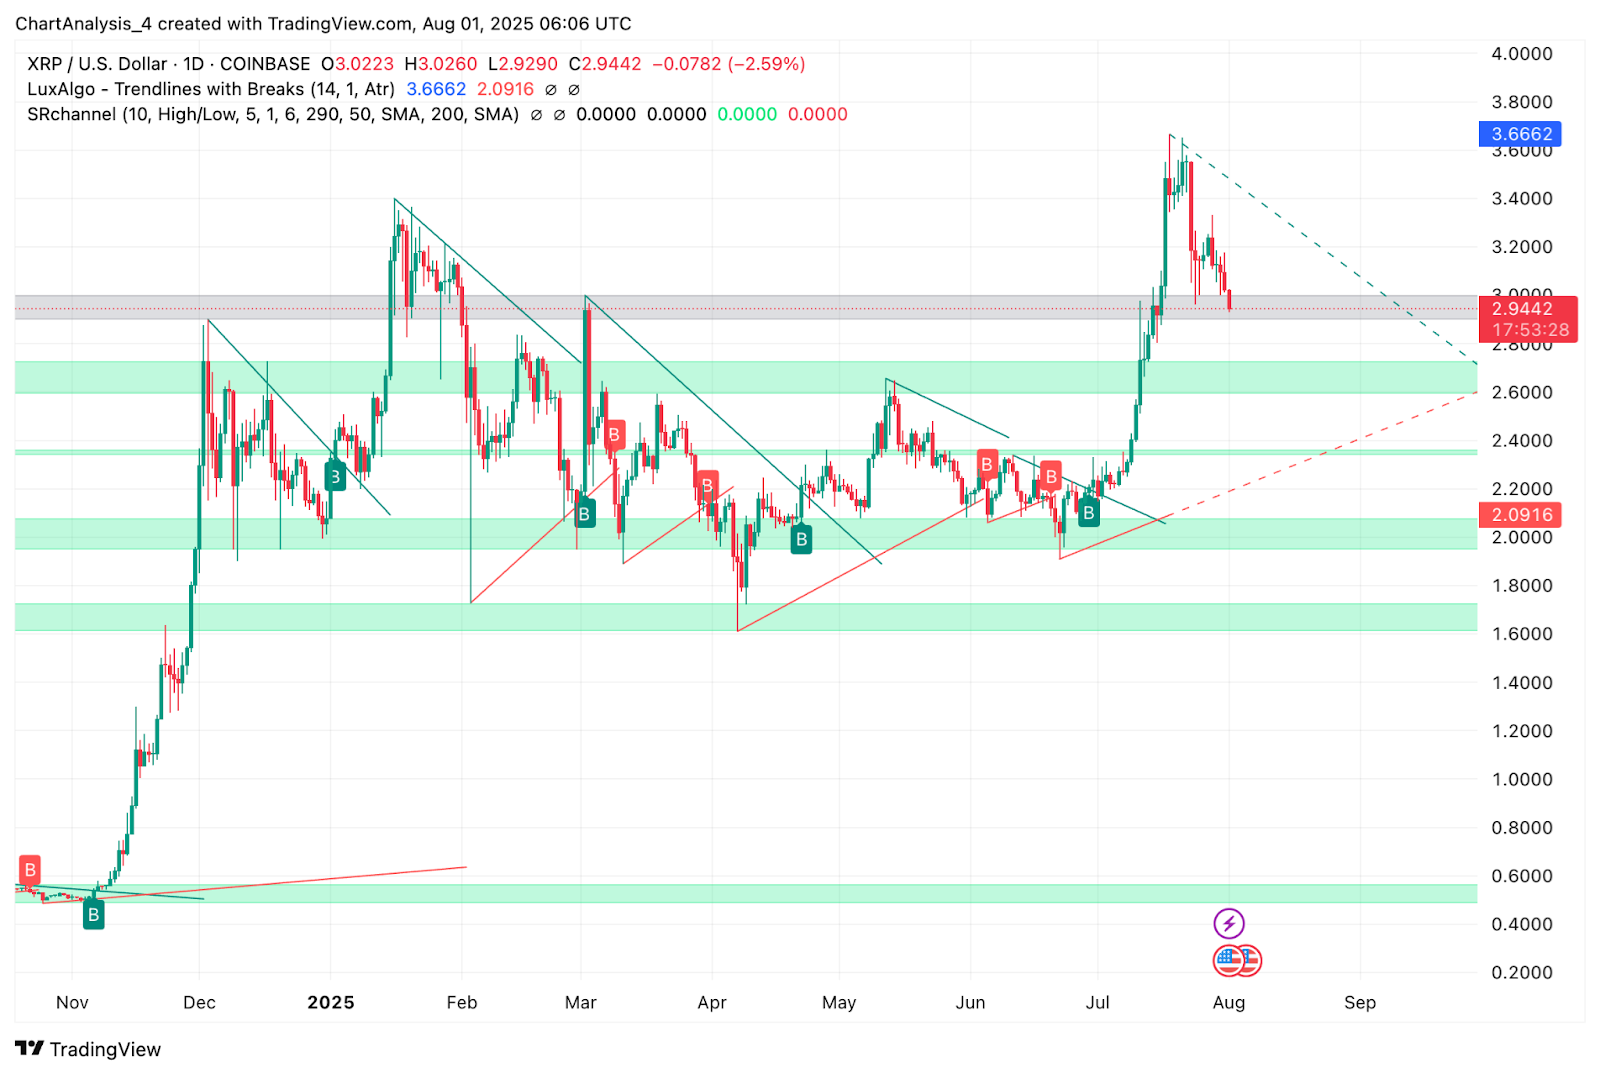
On the daily chart, XRP price is unwinding recent gains after forming an equal high near $3.66. A clear Change of Character (CHoCH) pattern is now visible below the $3.00 mark, suggesting a potential breakdown from the prior impulse structure. Price has re-entered a former supply zone and is currently testing the $2.91 support, aligned with the 200 EMA on the 4-hour chart.
The Smart Money structure also shows a loss of bullish dominance, with the last confirmed Break of Structure (BOS) now distant. As XRP dips back below prior liquidity pools, traders are watching whether the current pullback evolves into a deeper trend reversal or finds support near key EMAs.
Why Is XRP Price Going Down Today?
There are two key forces behind why XRP price going down today. First, from a technical perspective, XRP has broken below the short-term VWAP and key moving averages across intraday timeframes.
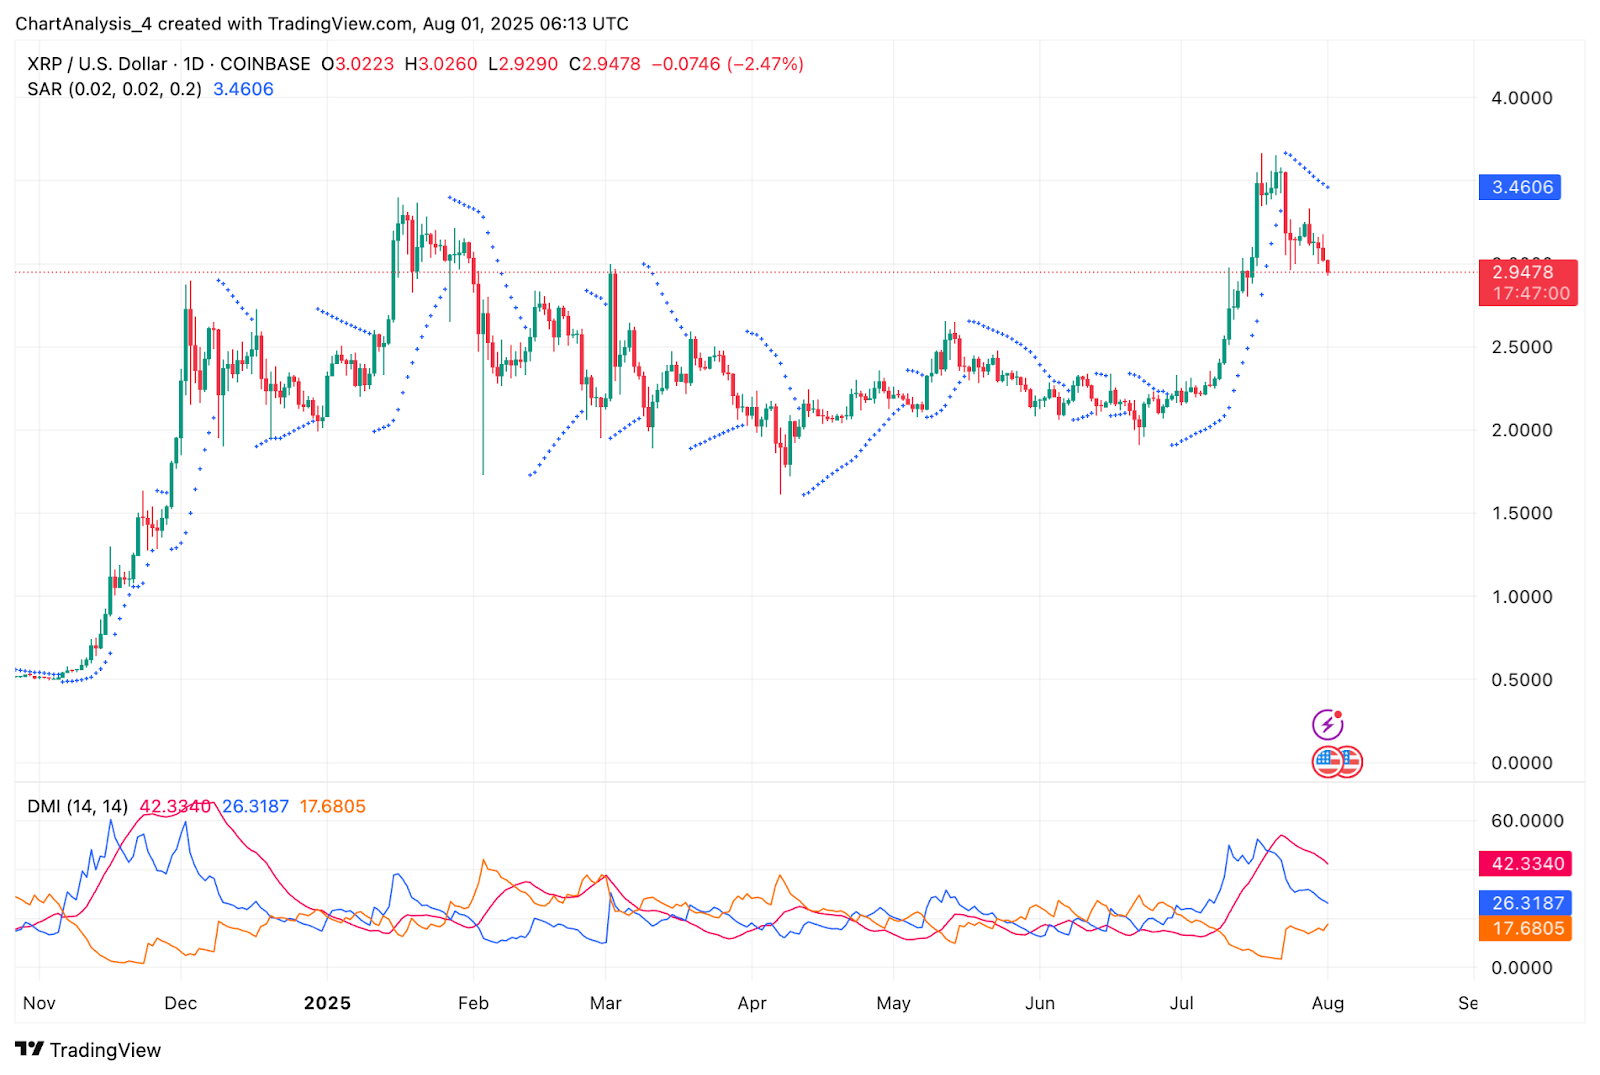
Directional indicators confirm the trend weakness. The DMI shows -DI crossing above +DI with a strengthening ADX, validating downside momentum. The Parabolic SAR has also flipped above price on the daily timeframe, reinforcing the shift.
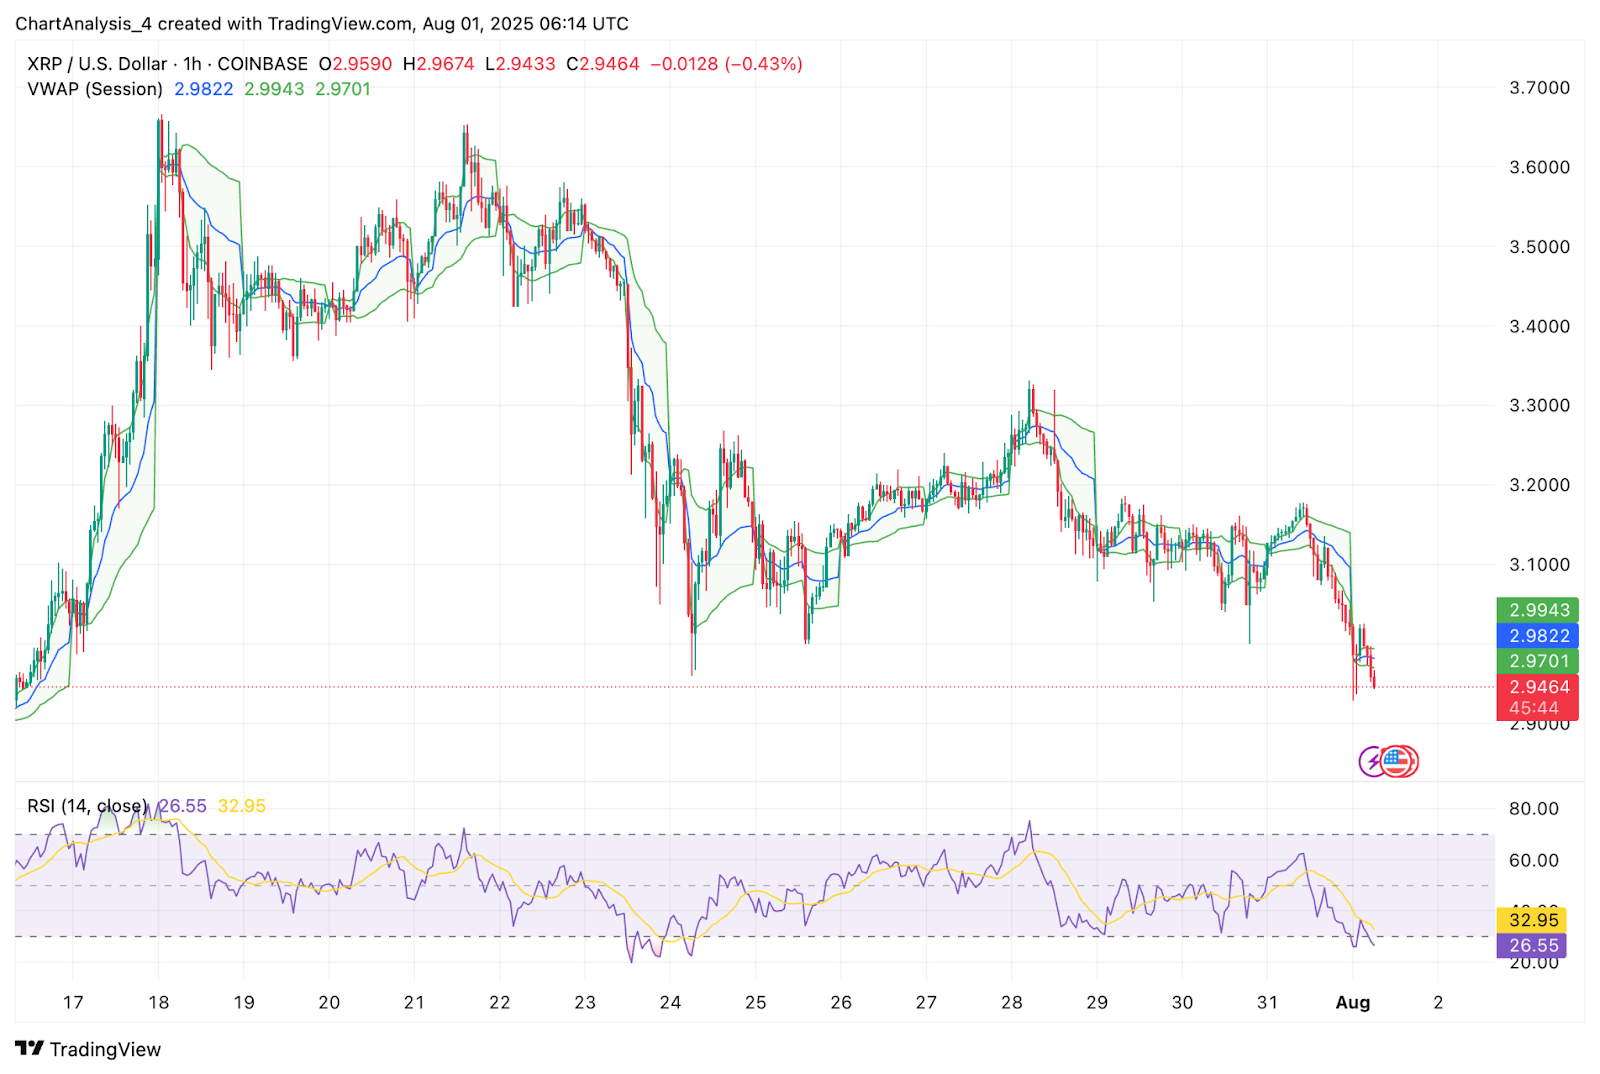
The 1-hour RSI has dipped to 32.9, showing oversold territory, yet no bullish divergence is forming. MACD and SAR have also flipped bearish, with the 4-hour Bollinger Bands expanding to the downside.
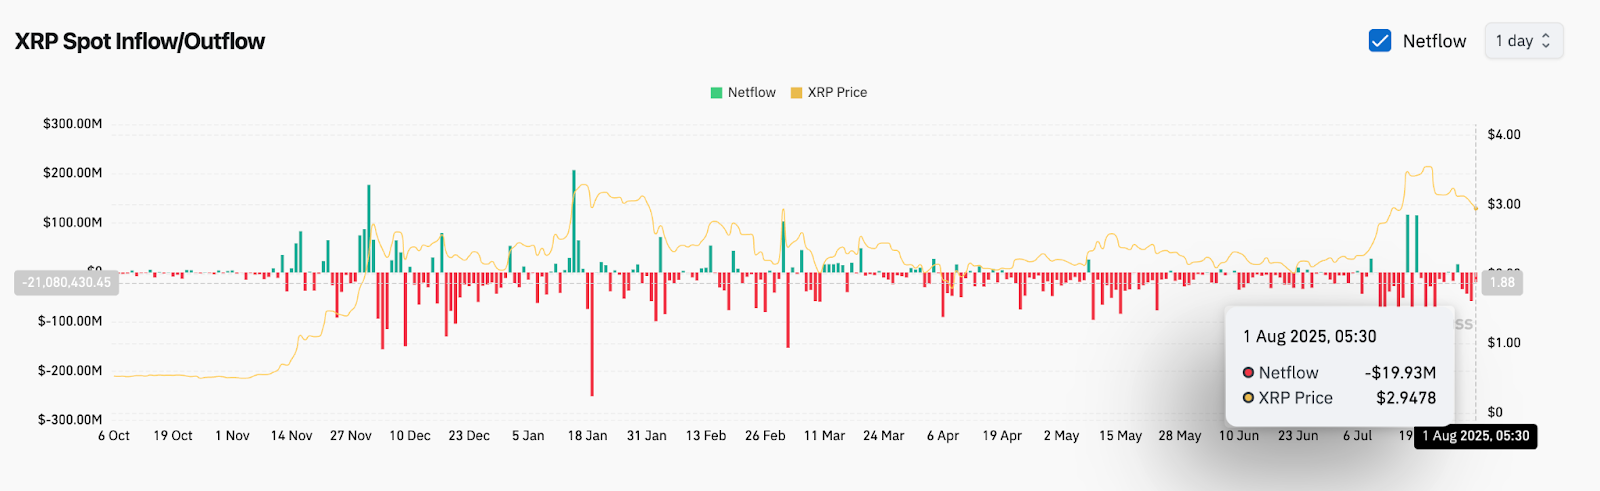
Second, on-chain and sentiment factors are shifting. Spot exchange data reveals nearly $20 million in net outflows over the past 24 hours, confirming capital flight amid fading short-term conviction. At the same time, recent commentary from Ripple CTO David Schwartz has reignited debate over the XRP Ledger’s actual usage.
Schwartz addressed concerns about the apparent lack of institutional on-chain activity, explaining that regulatory constraints often prevent banks from interacting freely with decentralized exchanges. He emphasized upcoming features such as permissioned domains, which aim to enable compliant financial institutions to transact securely on the ledger.
This clarification may have dampened speculative expectations in the short term, especially as traders recalibrate assumptions about XRP’s visibility on-chain versus its real-world utility.
Bollinger Bands, EMAs, and Momentum Gauges Signal Bearish Bias
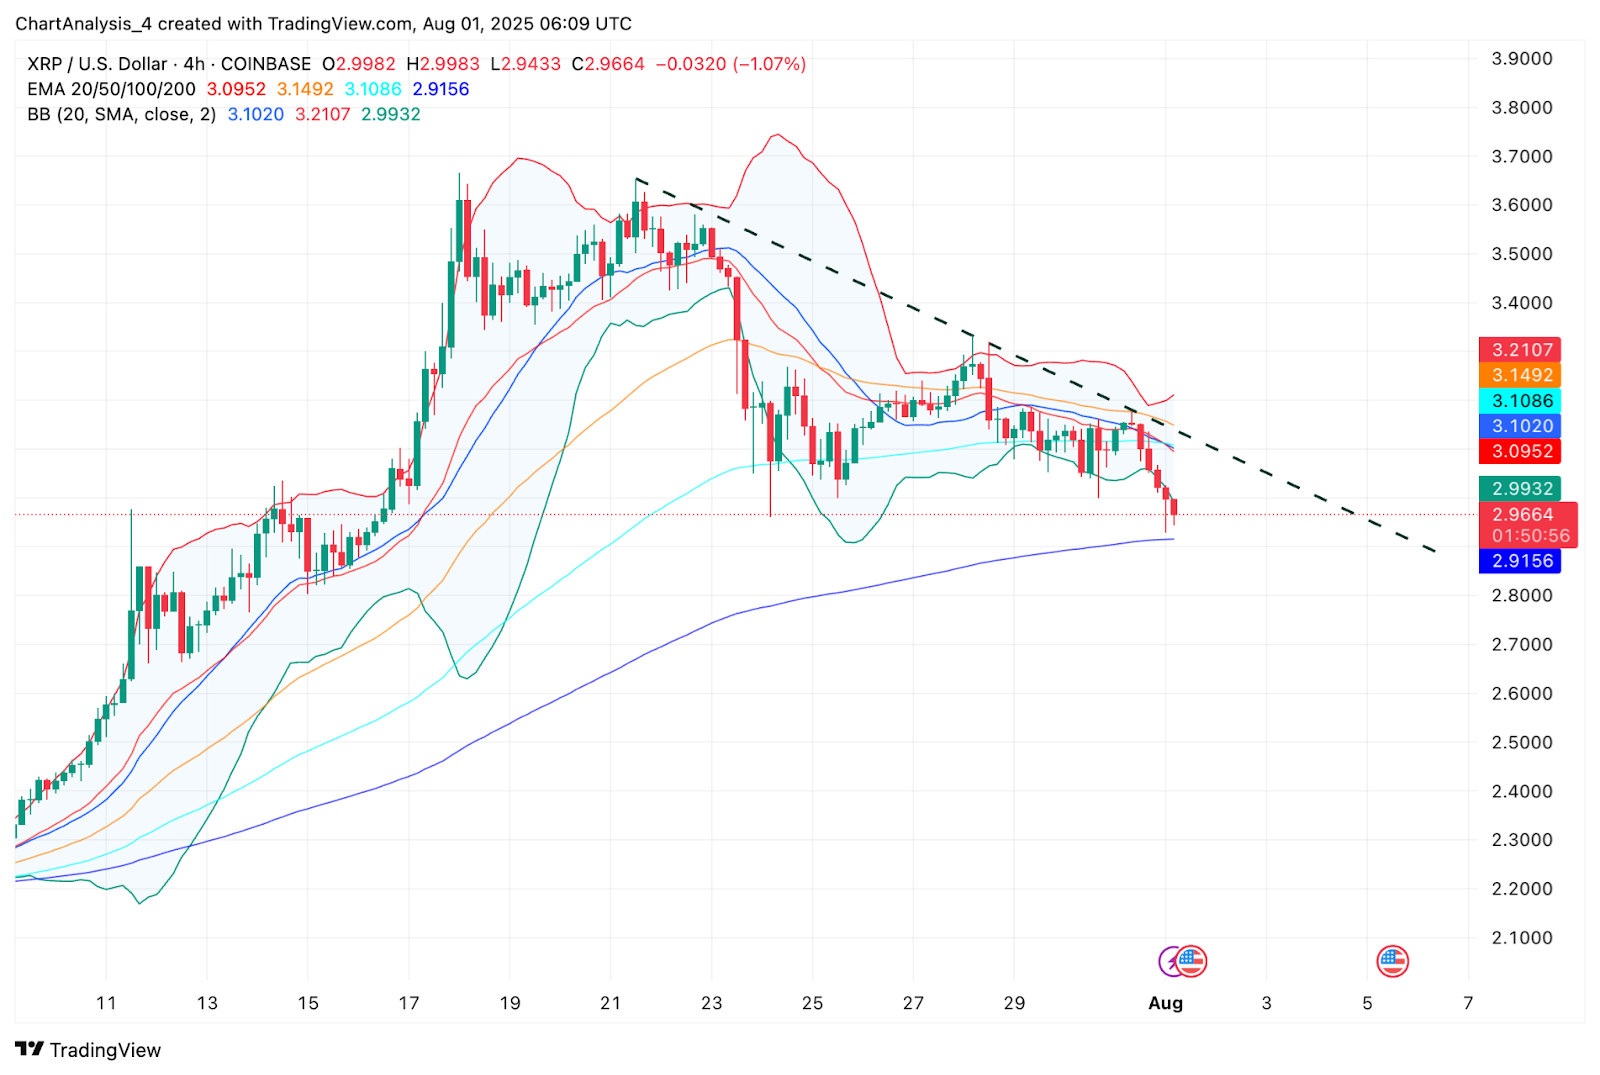
Technical pressure is building as the 4-hour chart shows rejection from the 20 EMA ($3.09), 50 EMA ($3.14), and trendline resistance. Bollinger Bands are now opening downward, with XRP price hovering near the lower band around $2.94. If this band fails to hold, a volatility expansion could trigger further losses toward the $2.66 liquidity shelf.
As of now, XRP trades below all major short-term EMAs. Unless bulls can reclaim the $3.00–$3.05 cluster with strong volume, the bias remains tilted toward continued reversion.
XRP Price Prediction: Short-Term Outlook (24H)
For August 2, XRP price is likely to remain under pressure unless the $2.91 support holds. A clean break below this level may open the door to the next downside target at $2.66, which previously acted as a demand zone in late July.
If bulls regain momentum and reclaim $3.02, a short-term bounce toward $3.20 could unfold, but this scenario requires strong inflow and a shift in market structure. For now, the combination of bearish EMAs, liquidity outflows, and technical rejection zones keeps XRP in a cautious posture.
Traders should monitor the $2.91–$2.94 region closely. A failure to defend this band may shift sentiment decisively bearish heading into the weekend.
XRP Price Forecast Table: August 2, 2025
| Indicator/Zone | Level / Signal |
| XRP price today | $2.9478 |
| Resistance 1 | $3.02 |
| Resistance 2 | $3.20 |
| Support 1 | $2.91 (200 EMA + liquidity zone) |
| Support 2 | $2.66 |
| RSI (1H) | 32.95 (Oversold, no divergence) |
| MACD (4H) | Bearish crossover expanding |
| EMA Cluster (4H) | Rejection at 20/50 EMA |
| Bollinger Bands (4H) | Expanded to downside |
| Parabolic SAR (1D) | Bearish (dots above price) |
| DMI (1D) | -DI leads, ADX rising (bearish) |
| VWAP (1H) | Price below VWAP |
| Spot Netflow (Aug 1) | -$19.93M (capital outflow) |
| Smart Money CHoCH | Bearish shift below $3.05 |
Disclaimer: The information presented in this article is for informational and educational purposes only. The article does not constitute financial advice or advice of any kind. Coin Edition is not responsible for any losses incurred as a result of the utilization of content, products, or services mentioned. Readers are advised to exercise caution before taking any action related to the company.