The Dogecoin price climbed above the $0.22 level this week, breaking out of a consolidation range since mid-2022.
In a post on X, trader Kamran Asghar identified a repeating setup that previously led to significant price increases. Notably, the chart highlights a double bottom pattern, a structure often viewed as a bullish signal when confirmed with a breakout.
A chart posted by the analyst includes three blue zones, each representing periods of accumulation. These periods are marked by relatively flat price movements, followed by strong upward breakouts once the asset clears resistance levels.
That breakout eventually led to Dogecoin’s all-time high of $0.7316. Meanwhile, from 2022 to 2025, the current consolidation has held within $0.055 to $0.22. The recent move above $0.22 is now seen as a potential early-stage breakout.
Dogecoin is trading at $0.2216, a 4.1% decrease in the past day, increasing the weekly loss to 15.4%. However, the memecoin still maintains a 34% surge in the past month, coinciding with the broader market move.
Double Bottom Breakout Signals Momentum Shift
Meanwhile, the chart also illustrates a double bottom pattern inside the most recent accumulation range. This pattern forms when a price hits a similar low twice before reversing direction. It is often interpreted as a sign of buying strength and trend reversal, particularly when accompanied by increased volume.
Asghar marked the $0.22 level as a breakout point. If Dogecoin holds above this threshold on a retest, the level may become solid support and confirm a possible shift toward a bullish trend. Notably, similar setups in the past have resulted in steep gains.
Analyst Predicts 226% Dogecoin Price Surge
According to a similar chart by trader Javon Marks, Dogecoin price may be preparing for a significant price move. The analysis highlights a recurring pattern of accumulation followed by breakout phases, similar to previous bull runs.
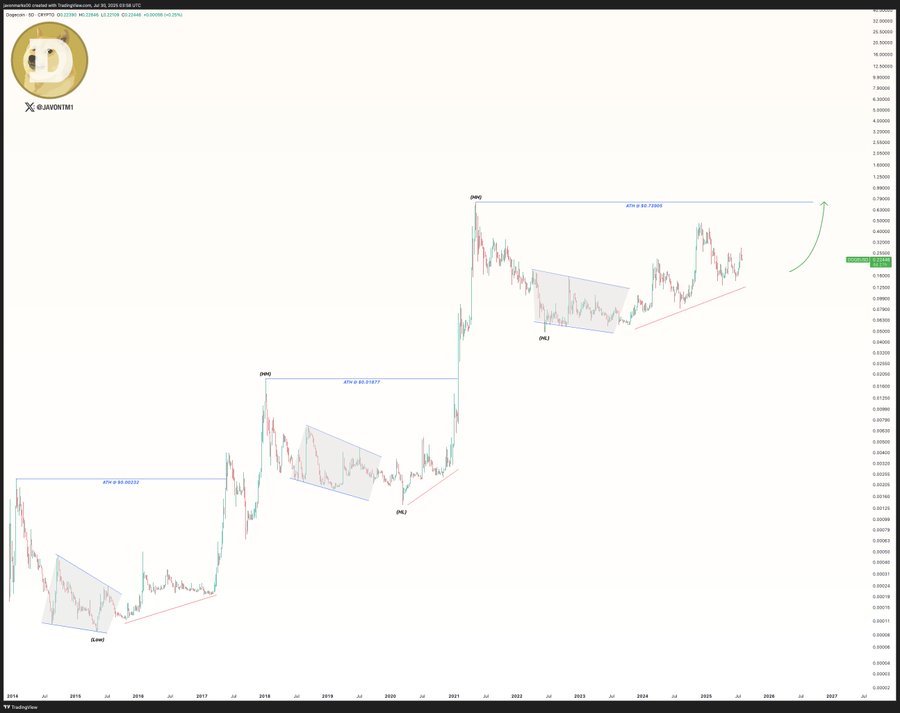
Marks points to a current breakout zone near $0.22, aligning with historical structures that preceded steep price increases. He projects a potential 226% rise from this level to retest the all-time high of $0.73905. The chart also outlines extended targets at $1.42 and $2.11, representing gains of over 830% from the current price range.
Other analysts remain bullish. According to Jireon, Dogecoin price has broken out of a double bottom pattern, with the neckline at $0.231 confirmed by a $4 billion volume spike. Jonathan Carter also noted a successful retest of the breakout level and a bounce from the 200-day moving average.
Meanwhile, Trader Tardigrade highlighted the appearance of a green Heikin Ashi candle on the monthly chart after five months of decline. Crowning the bullish sentiments, Bitcoinsensus reported a bullish MACD crossover, historically linked to gains of up to 610%.