


 20
20
- Ethena posts two consecutive days of declines after facing rejection at $0.70.
- Ethena’s recovery is in jeopardy, underpinned by shrinking funding rates and Open Interest.
- A Golden Cross pattern, a MACD buy signal and potential support at $0.66 could keep $ENA price elevated near its recent highs.
Ethena ($ENA) price remains suppressed for two consecutive days, trading at $0.60 at the time of writing on Tuesday. The synthetic dollar protocol built on Ethereum (ETH) has extended the decline 15% below its recent peak of $0.70.
If the decline persists under the initial support at $0.60, recovery could be a tall order, considering the potential spike in macroeconomic risks this week. The Federal Reserve (Fed) is expected to make its decision on interest rates on Wednesday, with United States (US) President Donald Trump’s higher tariffs scheduled to take effect on Friday.
Ethena faces declining funding rates and open interest
The derivatives market raises concerns about Ethena’s fundamental outlook amid a noticeable drop in the futures funding rates and Open Interest. CoinGlass data highlights a significant drop in the weighted funding rate to 0.0064% after peaking briefly at 0.0404% on July 23.
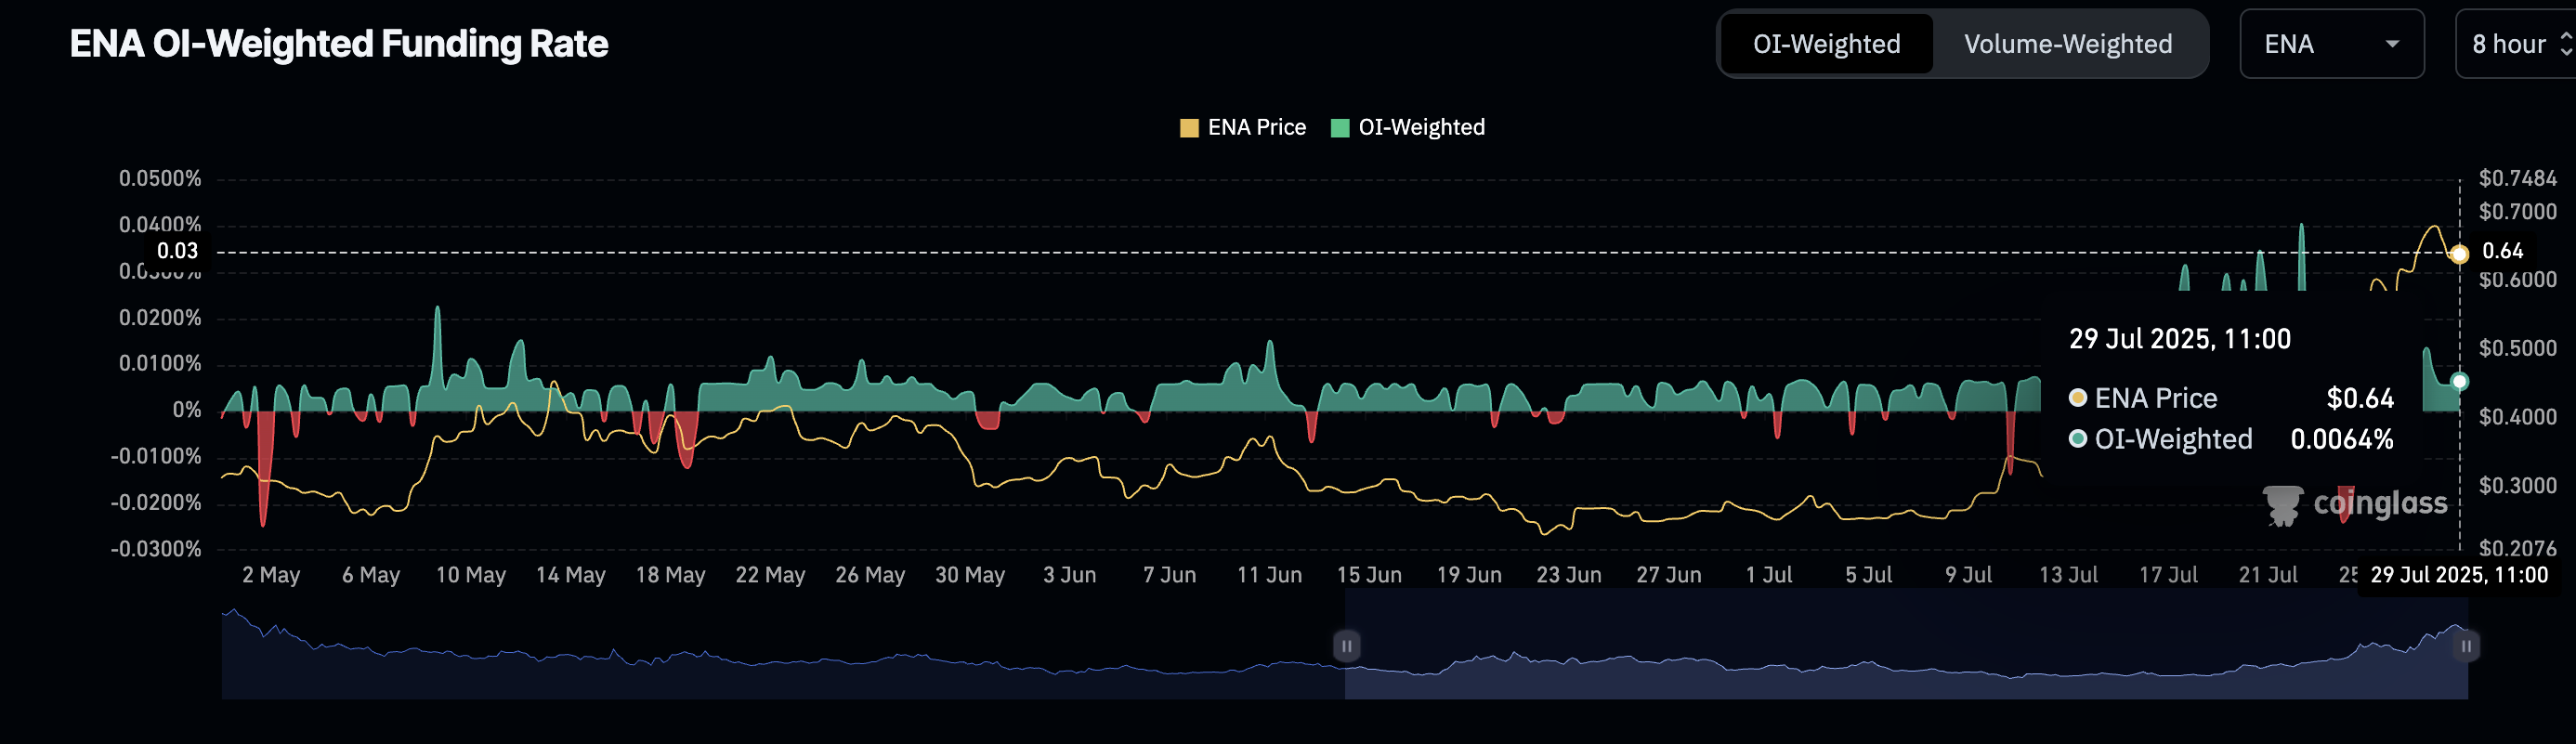
Ethena weighted funding rates | Source: CoinGlass
Low funding rates imply fading bullish sentiment as fewer traders bet on the $ENA price increasing. This, coupled with a 14% decline in the derivatives market’s Open Interest, indicates a lack of conviction in the uptrend’s continuation. Fewer traders are seemingly betting on the $ENA price reaching higher levels.
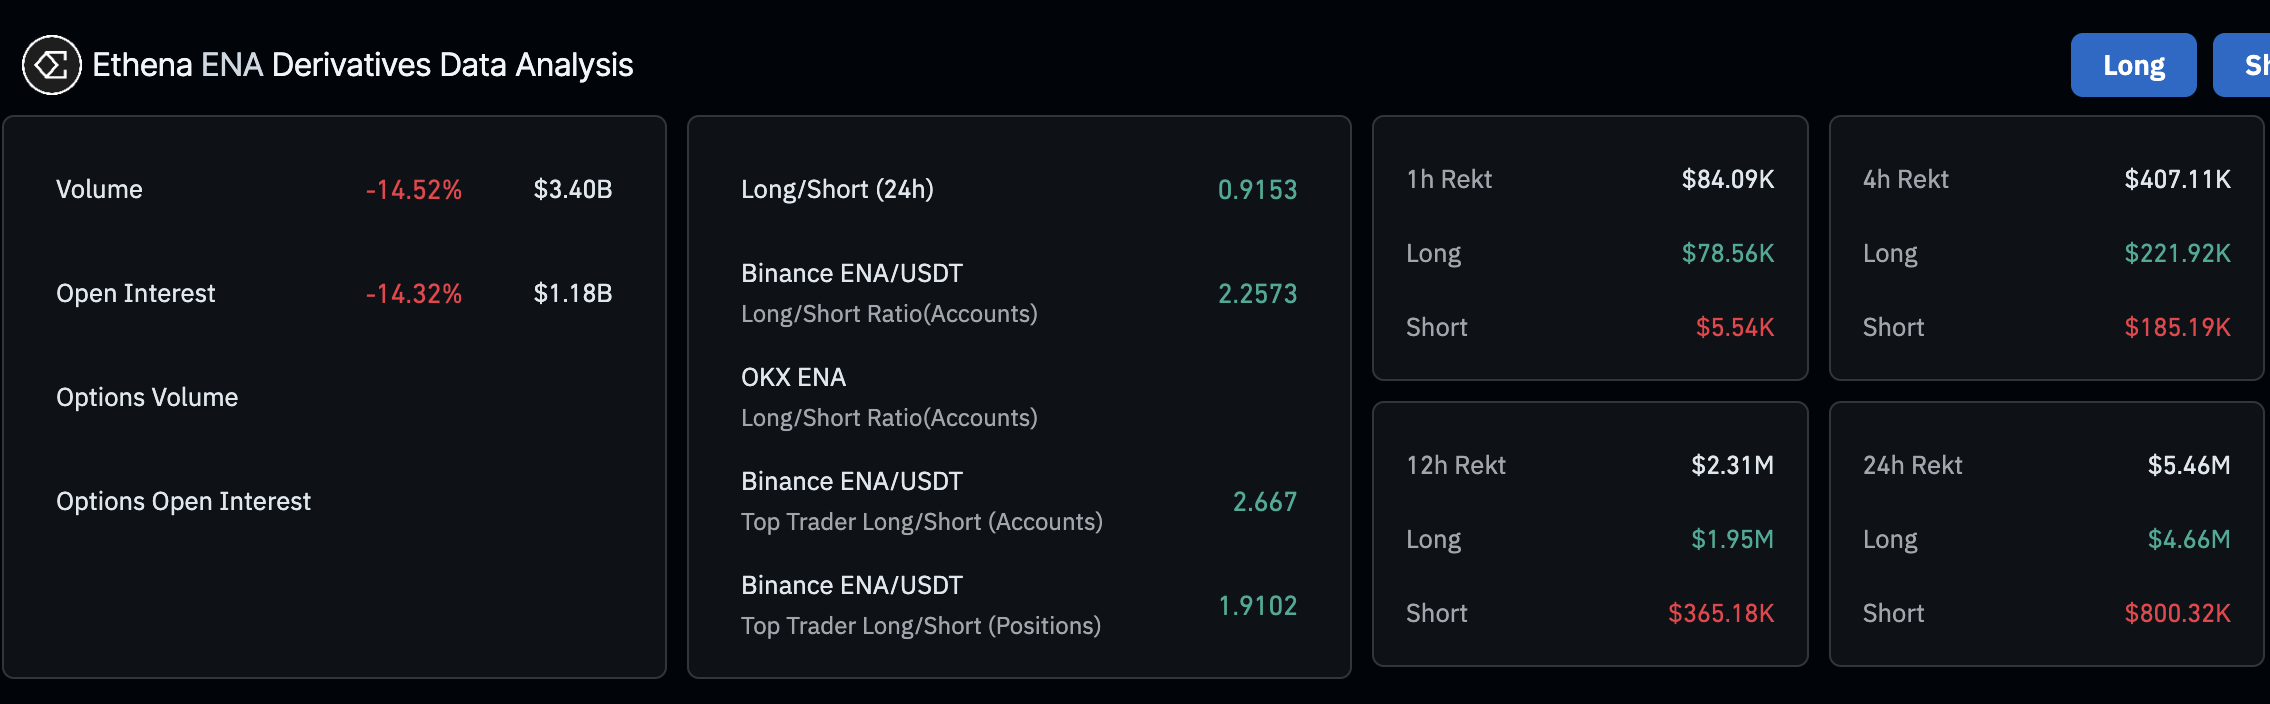
Ethena derivatives market data | Source: CoinGlass
Technical outlook: Ethena could extend the pullback
Ethena price holds above the short-term support at $0.60, supported by a buy signal from the Moving Average Convergence Divergence (MACD) indicator, sustained since July 8. Traders increased exposure with the blue MACD line above the red signal line. If this structure is maintained in upcoming sessions, $ENA could significantly reduce downside risks.
Still, the Relative Strength Index's (RSI) downward movement within overbought territory indicates fading demand amid a surge in bearish momentum. If the RSI decline continues, the path of least resistance would remain downward.
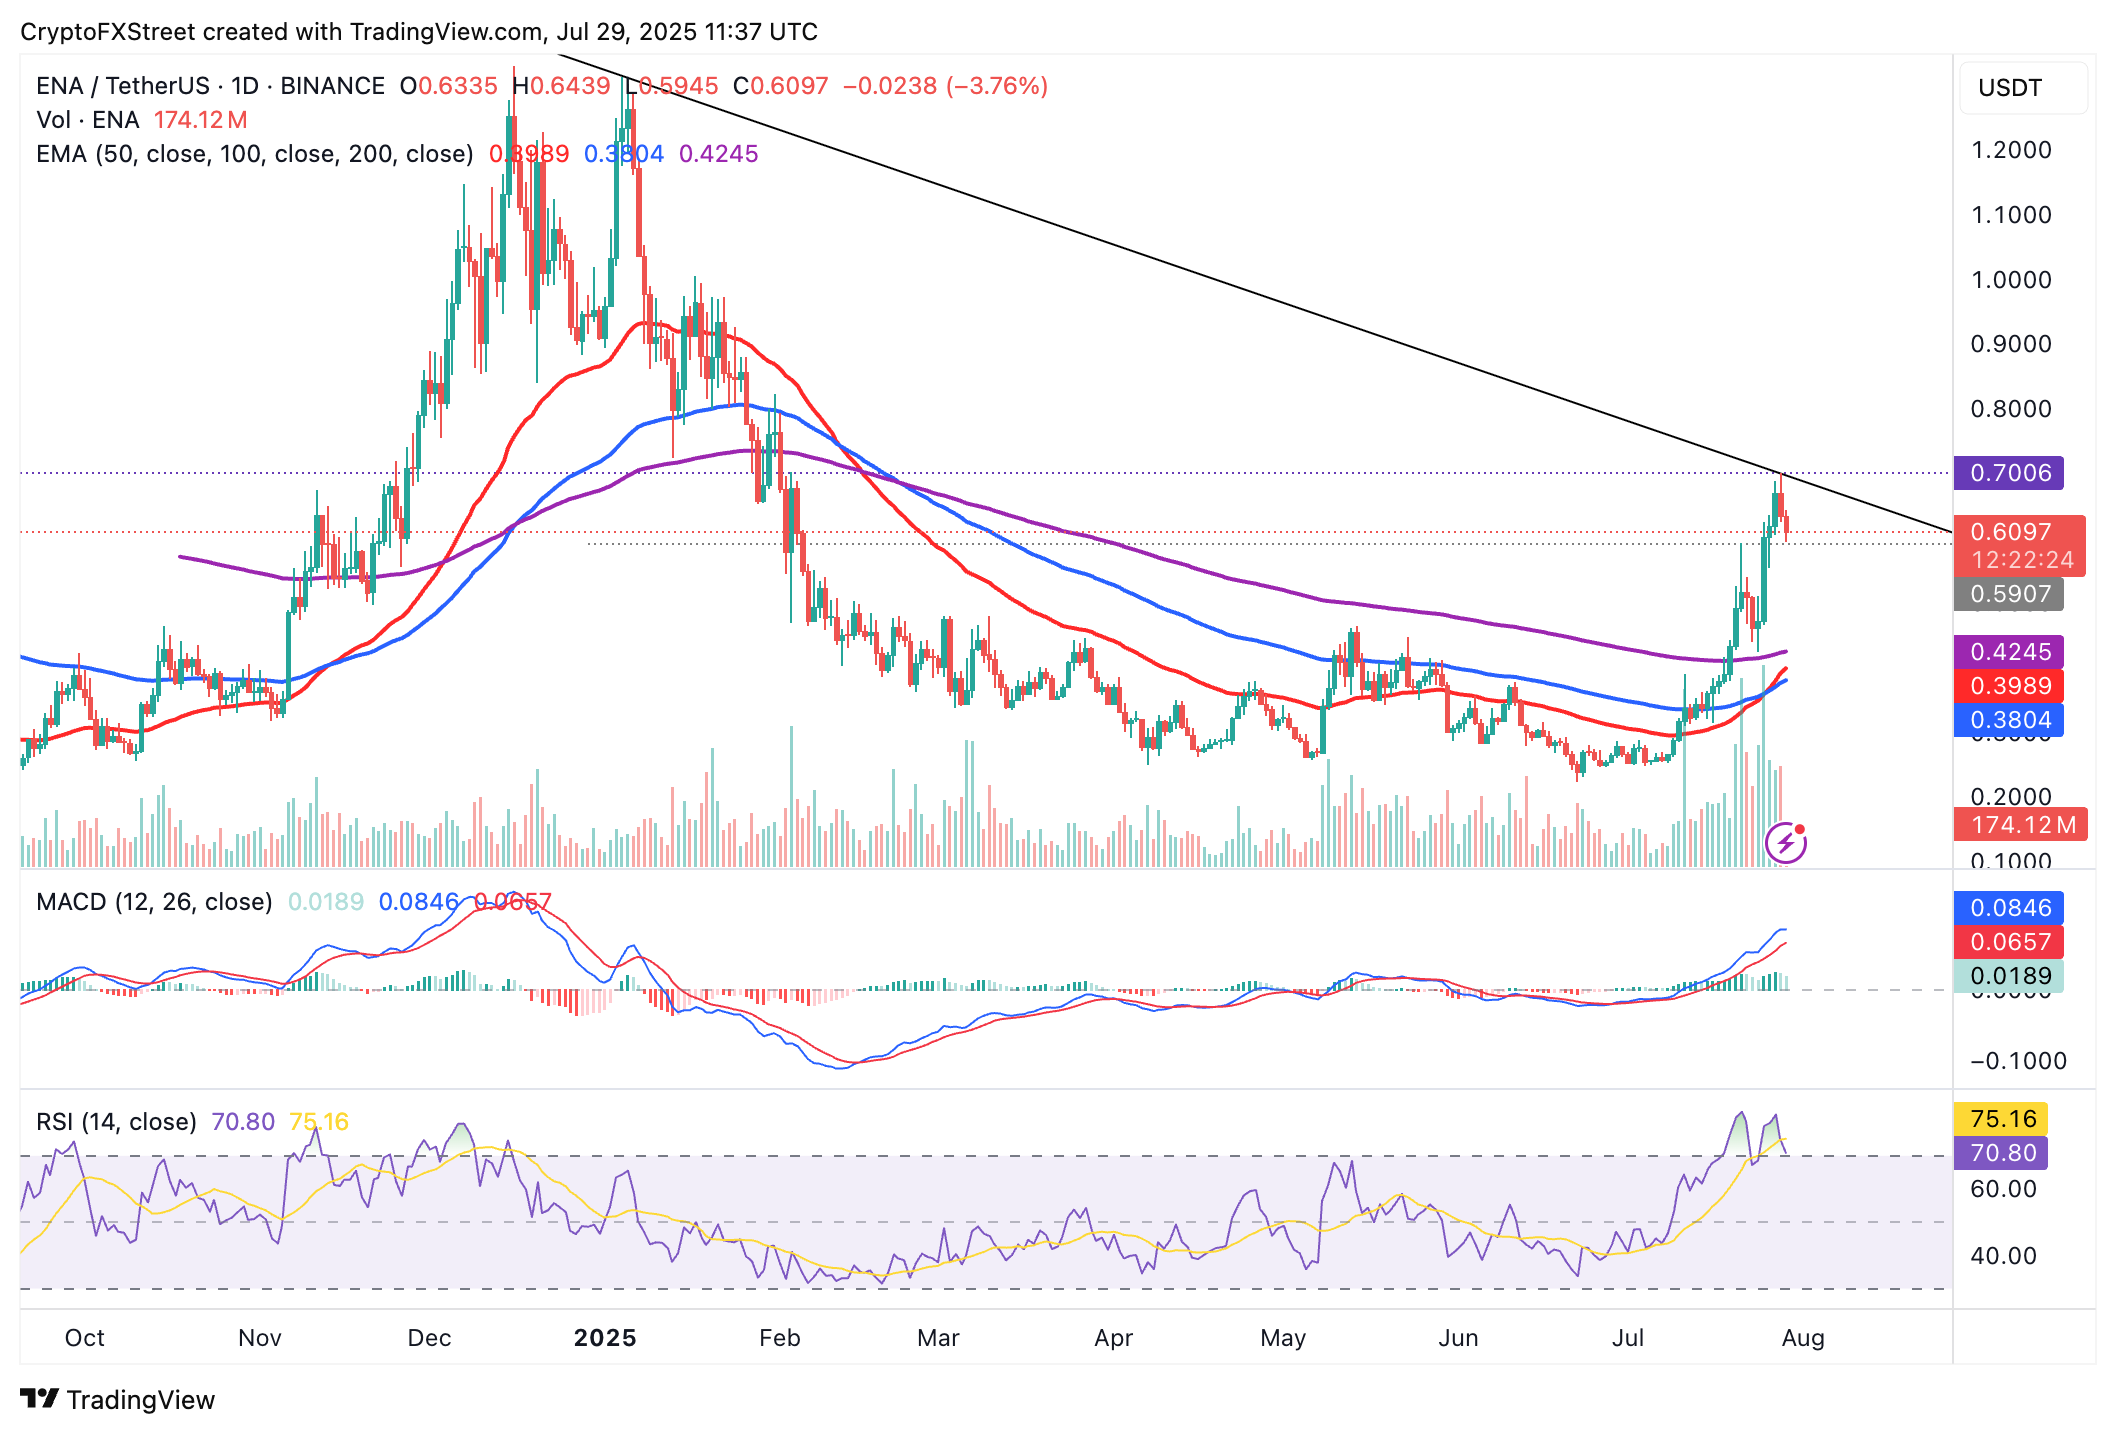
$ENA/USDT daily chart
The 200-day Exponential Moving Average (EMA) at $0.42, the 50-day EMA at $0.39 and the 100-day EMA at $0.38 hold as tentative support levels in the event the decline extends below the support at $0.60.
A Golden Cross pattern established when the 50-day EMA crossed above the 100-day EMA on Sunday, suggests market sentiment is improving, and that Ethena has a higher probability of resuming the uptrend toward the $1.00 target than extending the decline.