


 23
23
A bullish flag pattern on the Sui ($SUI) daily chart has drawn attention, suggesting a possible breakout that could send the token toward $4.80. In a recent tweet, crypto analyst Carl Moon shared a TradingView chart based on Bybit’s $SUI/USDT pair, showing a descending channel that followed a strong July rally.
$SUI is about to pump if it breaks out of this bullish flag to the upside!
— Carl Moon (@TheMoonCarl) July 26, 2025
The target is $4,80🎯
🟨 Trade #$SUI on WEEX — https://t.co/9OSGqK8UTY – NO KYC – Earn 20% Deposit Reward (Up to $30,000 for Whales) + FREE VIP 2 (25% Fee Discount) pic.twitter.com/44SAfW8z0j
According to the analysis, $SUI has broken out of this structure, opening the door for a 19.28% upside from the breakout point. The chart covers price action from early June to the end of July, showing $4.80 as the next resistance level.
Market Performance and Trading Activity
As of press time, $SUI is trading around $4.00 after posting a 9.35% gain over the past 24 hours. According to CoinMarketCap data, the token’s market capitalization is $13.81 billion. The unlocked market cap is the same, while the fully diluted valuation (FDV) is estimated at $39.9 billion.
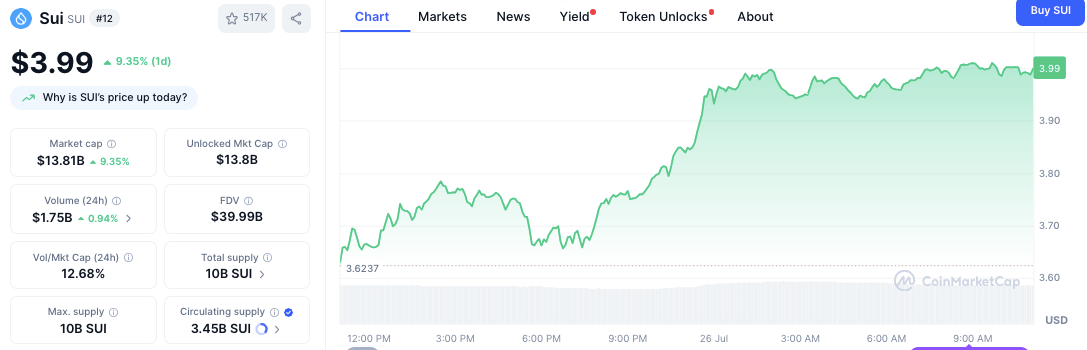
Over the same 24-hour period, trading volume reached $1.75 billion, producing a volume-to-market-cap ratio of 12.68%. This shows an increase in trading activity as the price rebounded from a session low of $3.62.
Related: Why Sui ($SUI) Could Lead the Next Major Crypto Bull Cycle
Technical Indicators Signal Continued Momentum
The bullish flag structure emerged as a result of a short consolidation phase marked by lower highs and lower lows. The breakout from this range is considered a major development by analysts, who estimate a projected move based on the height of the rally preceding the channel. The technical target of $4.80 acts as a key resistance zone if upward momentum continues.
Momentum indicators are currently in support of the breakout. The Relative Strength Index (RSI) stands at 62.95, just below the signal line at 64.97, placing the token in bullish territory without signaling overbought conditions. An RSI reading above 70 would reflect excessive buying pressure, so the current level suggests the trend has room to continue.
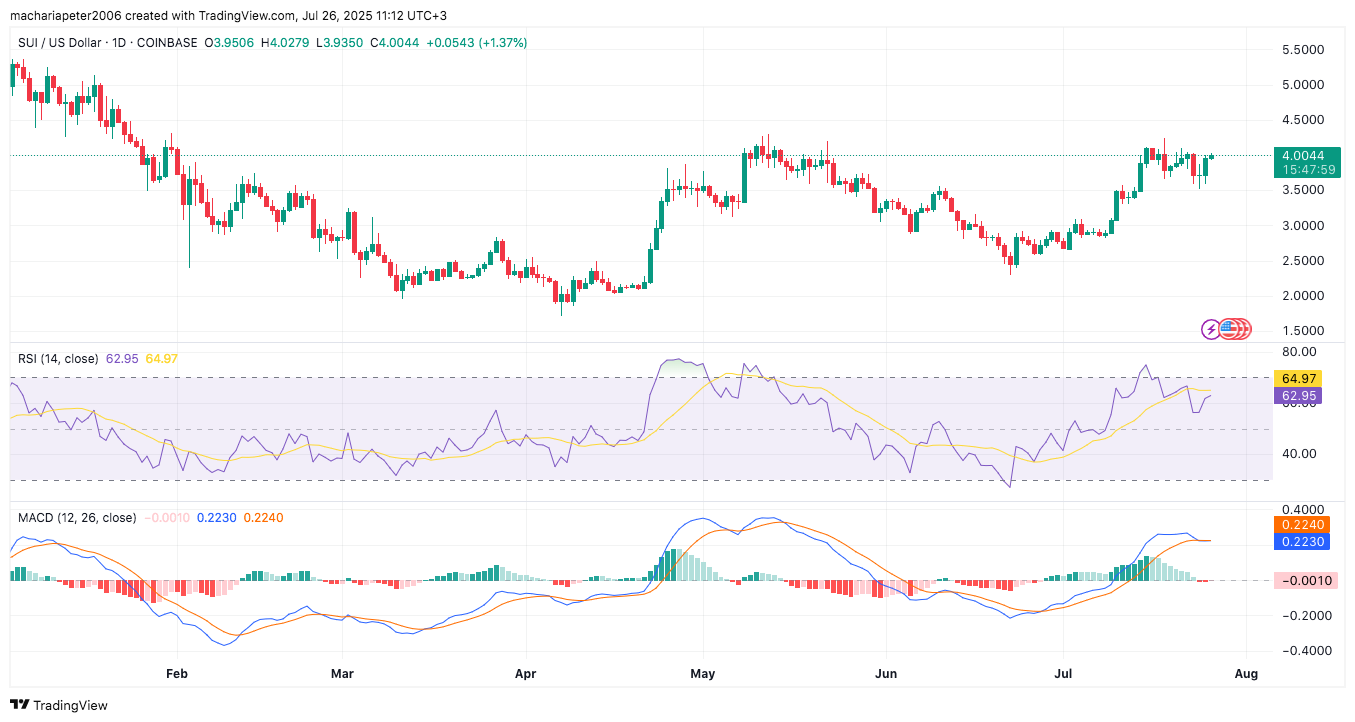
Moreover, the MACD line is at 0.2230, slightly under the signal line at 0.2240, with a histogram value of -0.0010. Although the MACD and signal lines are nearly equal, the formation follows a previous bullish crossover observed in early July, which preceded a large price increase.
Related: Sui ($SUI) Price Prediction 2025, 2026, 2027, 2028, 2029-2030
Disclaimer: The information presented in this article is for informational and educational purposes only. The article does not constitute financial advice or advice of any kind. Coin Edition is not responsible for any losses incurred as a result of the utilization of content, products, or services mentioned. Readers are advised to exercise caution before taking any action related to the company.
