XRP just had the same rare golden cross on its Bitcoin pair that happened before the 158% rally last year, and the structure is lining up almost exactly the same.
This specific crossover, where the 23-day moving average flips above the 200-day, is not something you see every day on long time frames. The last time it appeared on the XRP/BTC chart, the price shot up from 0.00001182 to 0.00003057 in just 14 days — a 158.66% surge.
That same 23/200-day golden cross has now reappeared. XRP/BTC has gotten back the 50-day and 200-day moving averages. A long-wick candle already hit the 200-day line, just like in 2024, and buyers jumped in right away.
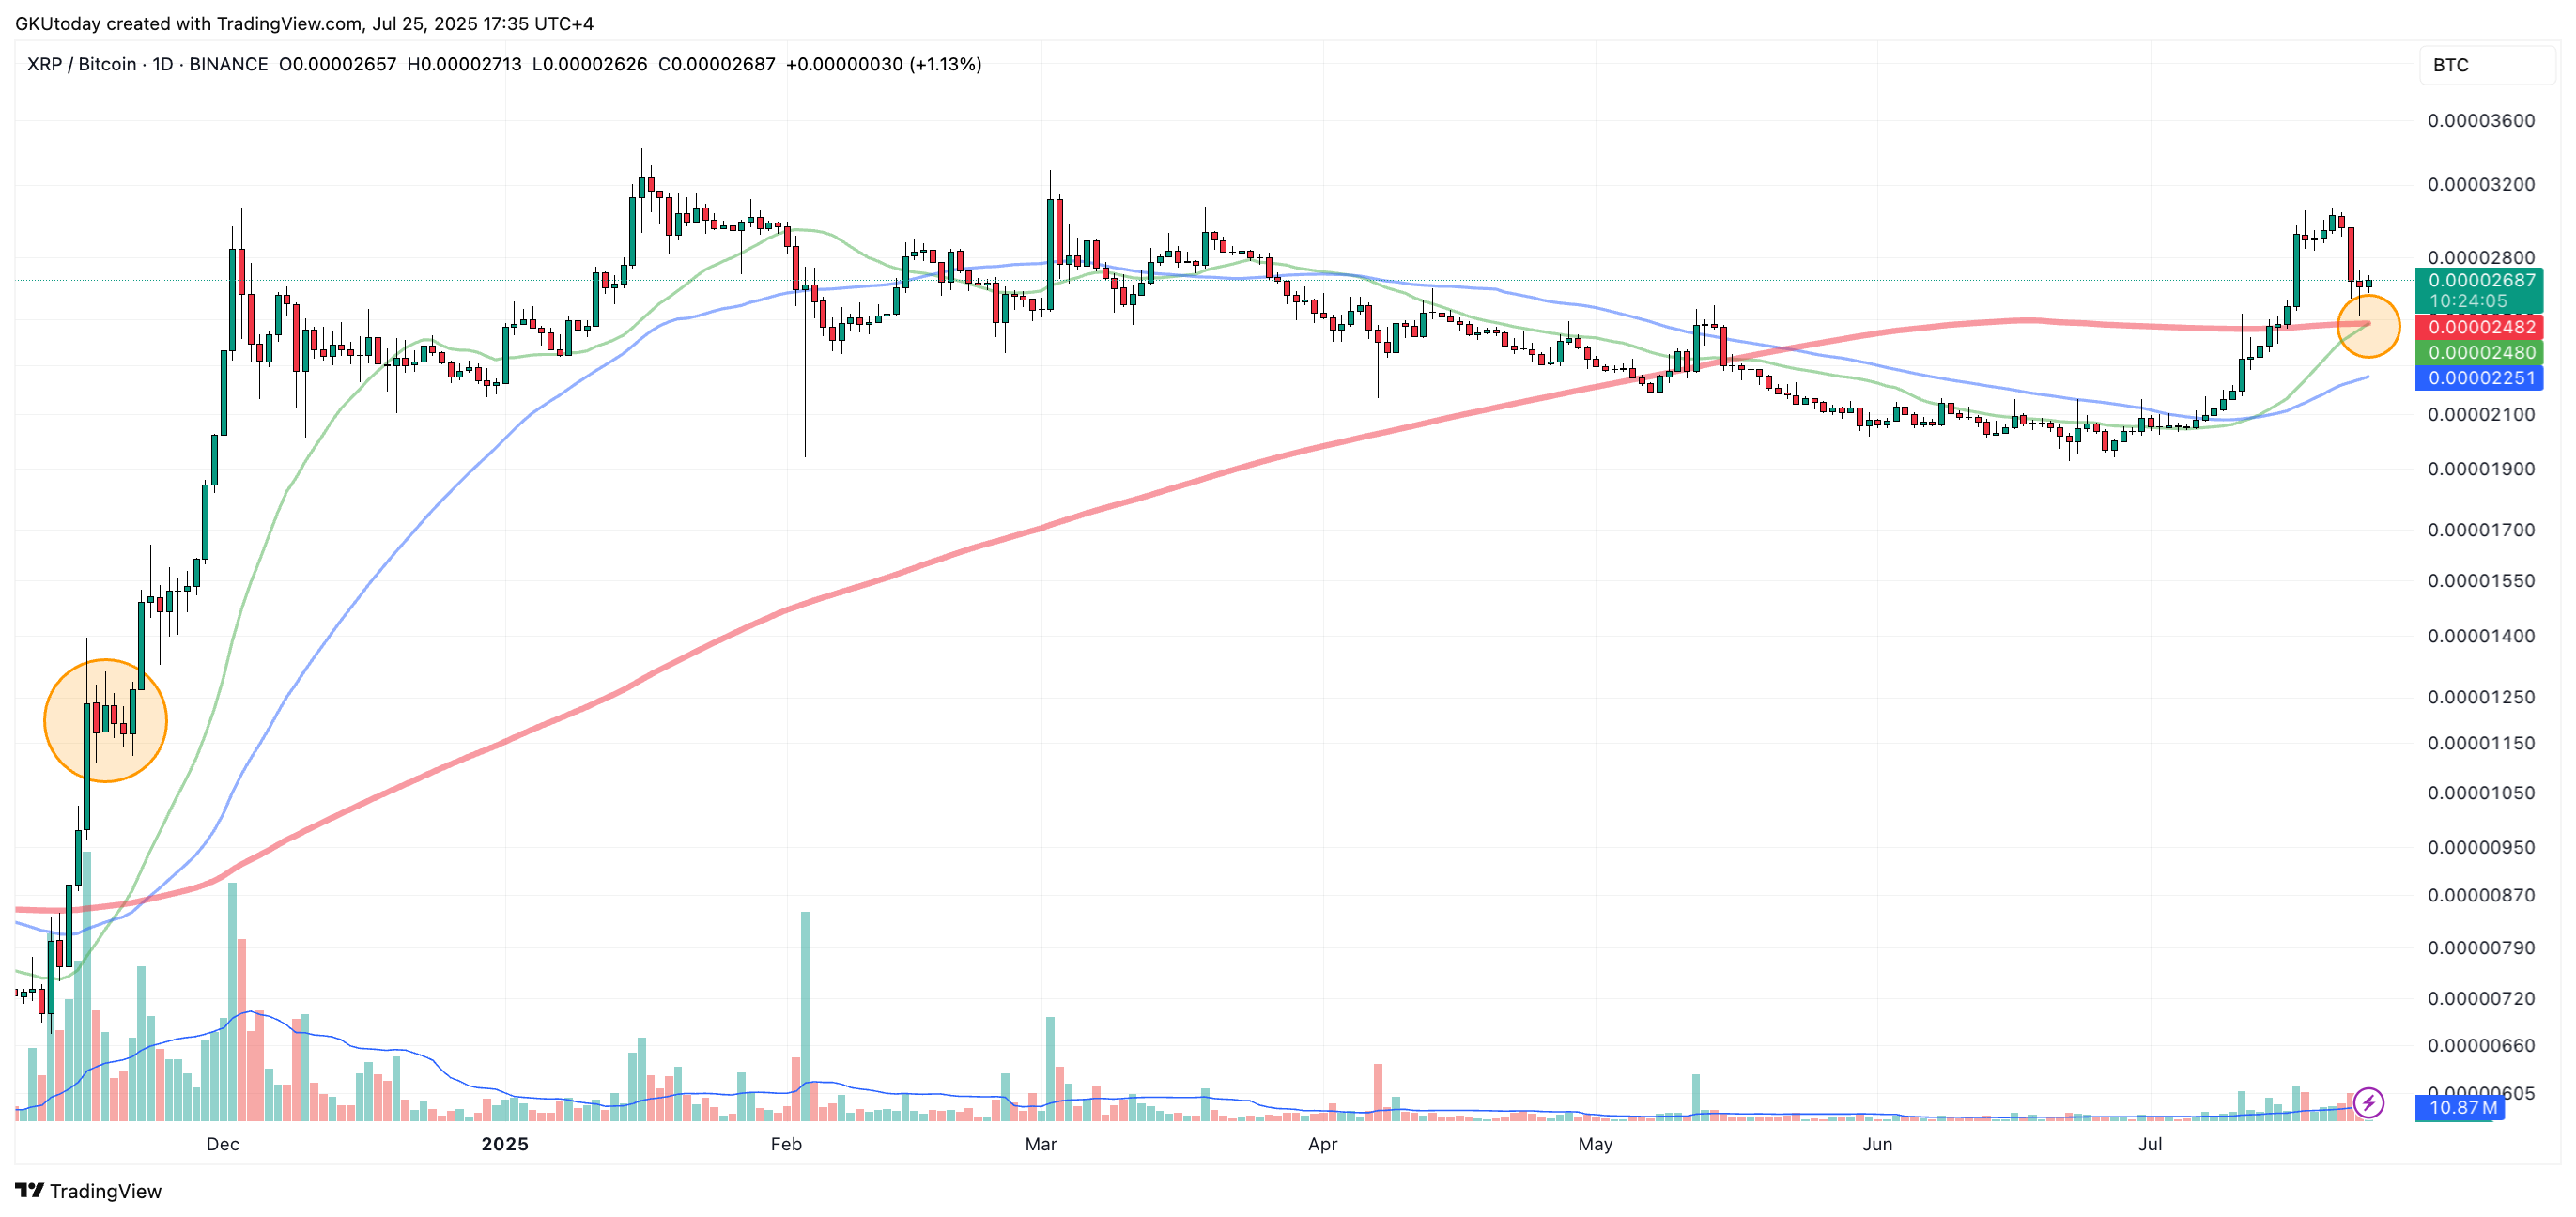
The pair is currently stabilizing in the 0.00002480 to 0.00002684 zone, which is similar to the structure from the last breakout. At that time, XRP was trading sideways above the crossover point for a few days before shooting up. So far, this setup is going at the same speed.
Why now?
Bitcoin has not moved much recently, which makes people focus even more on XRP's BTC ratio. If the volume starts to build again and XRP breaks above the current resistance band, we could see the same kind of move.
This is not about hope or speculation; it is about an almost perfect reappearance of a rare technical signal with a track record. It does not matter if it is another 158% push; the conditions that led to it are back in place again.
Whether or not it plays out the same way, the trigger is now active. The timing, with altcoins taking center stage and Bitcoin giving them space to breathe, also seems perfect.