


 25
25
Tezos has broken through key resistance levels after a sudden vertical rally, with the Tezos price today trading around $1.15. A surge in inflows, strong momentum signals, and a breakout above major EMAs has flipped market structure bullish, lifting $XTZ price to its highest level since March.
What’s Happening With Tezos’s Price?
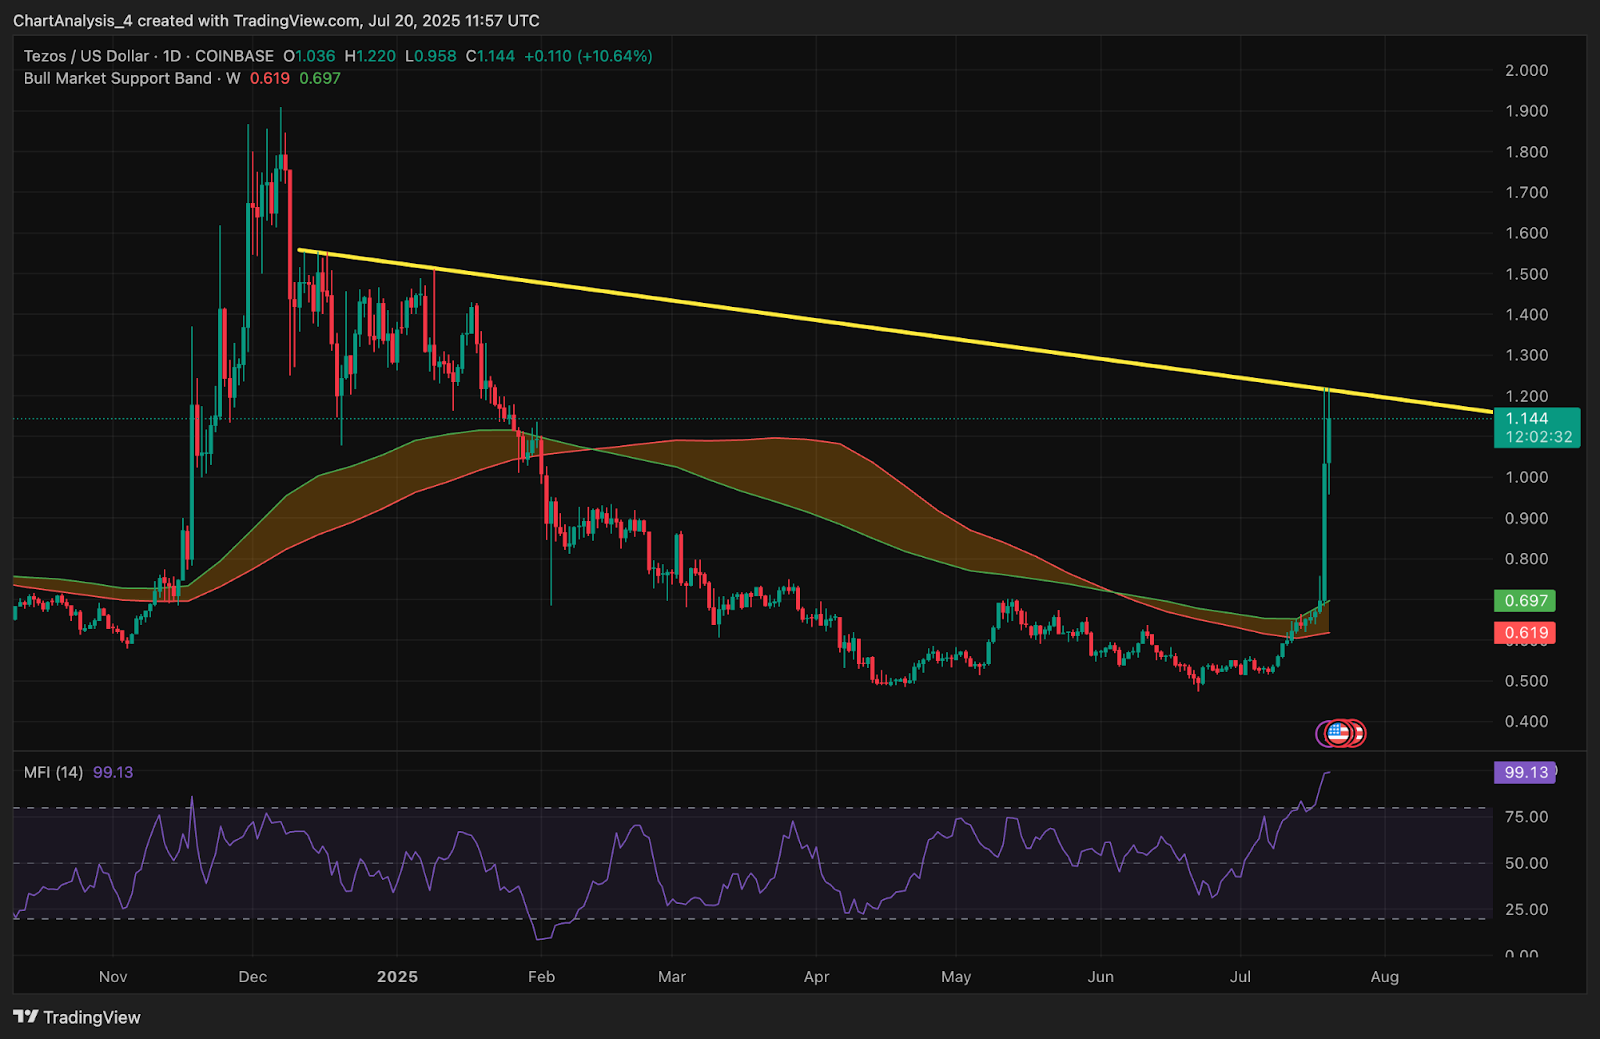
On the daily chart, $XTZ price has exploded above its 20/50/100/200 EMA cluster, slicing through the $0.70–$1.00 range. The move comes after prolonged compression under $0.70, followed by a powerful breakout on July 19. Price tapped an intraday high of $1.22 before consolidating near $1.14.
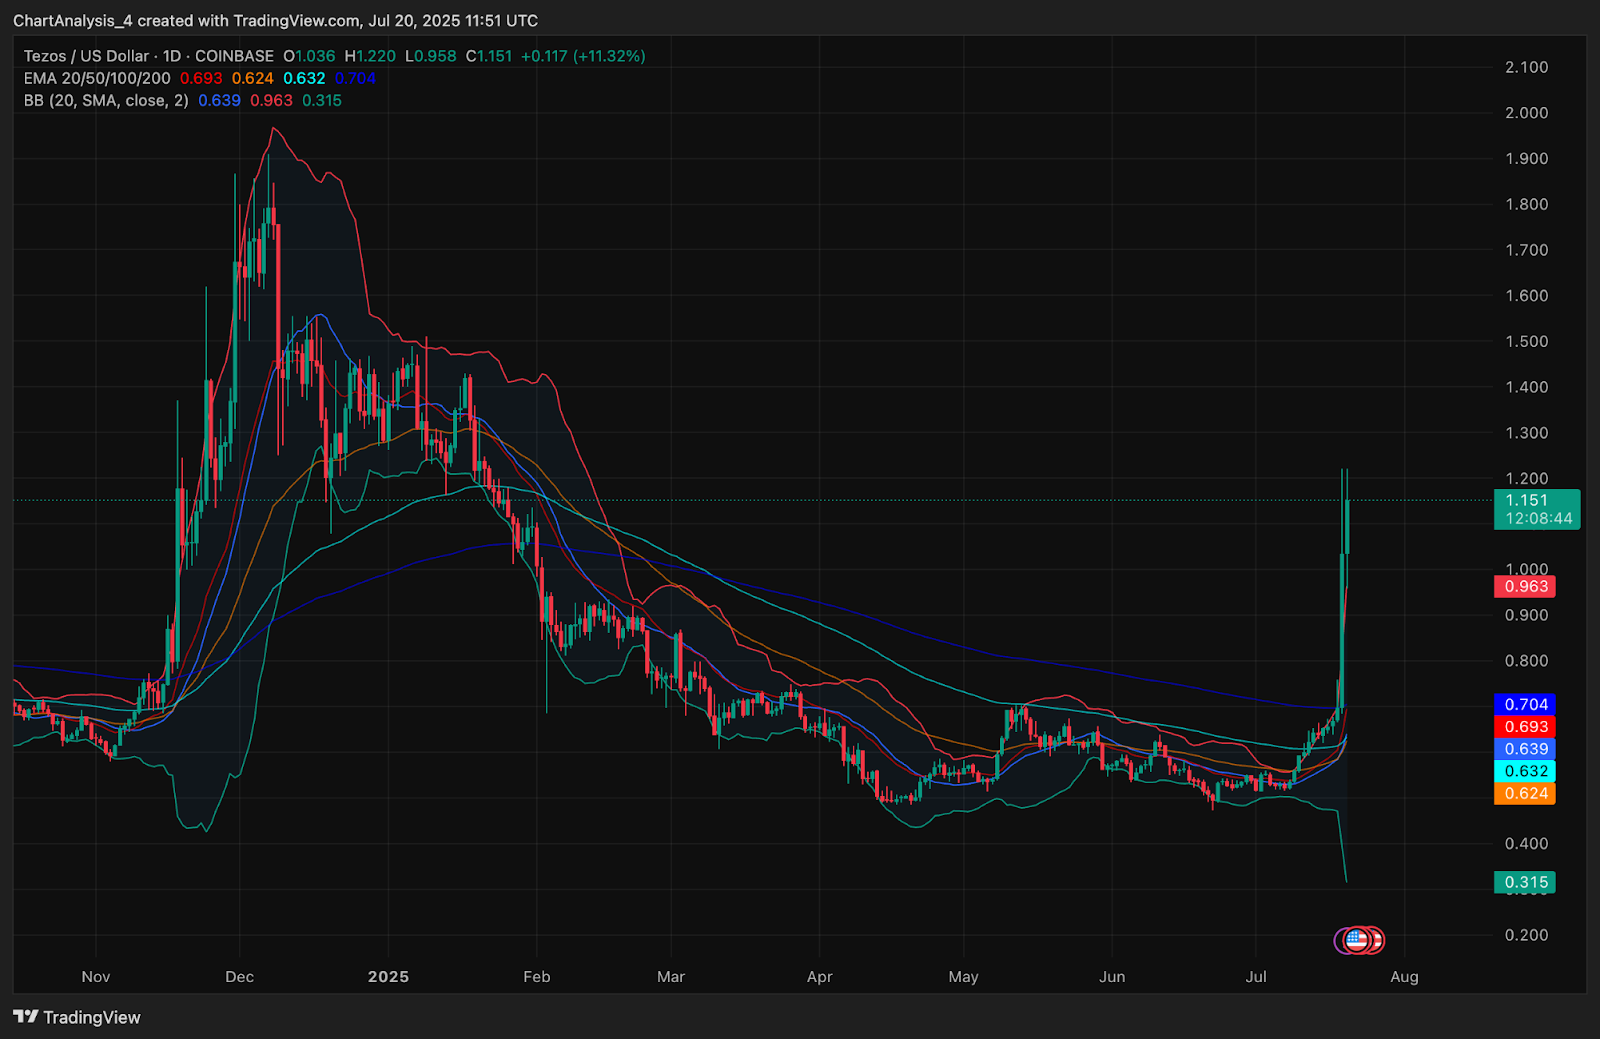
The Bollinger Bands show massive expansion around this breakout, with the upper band widening sharply and the candle closing well above the mean band ($0.64). This confirms a volatility-led breakout event. Meanwhile, price is currently pressing into a long-standing descending trendline just under $1.25, acting as macro resistance.
Volume has also exploded, with the Money Flow Index reaching an extreme 99.1 on the daily chart. This signals intense capital movement into Tezos, consistent with the sharp rally.
Why Is The Tezos Price Going Up Today?
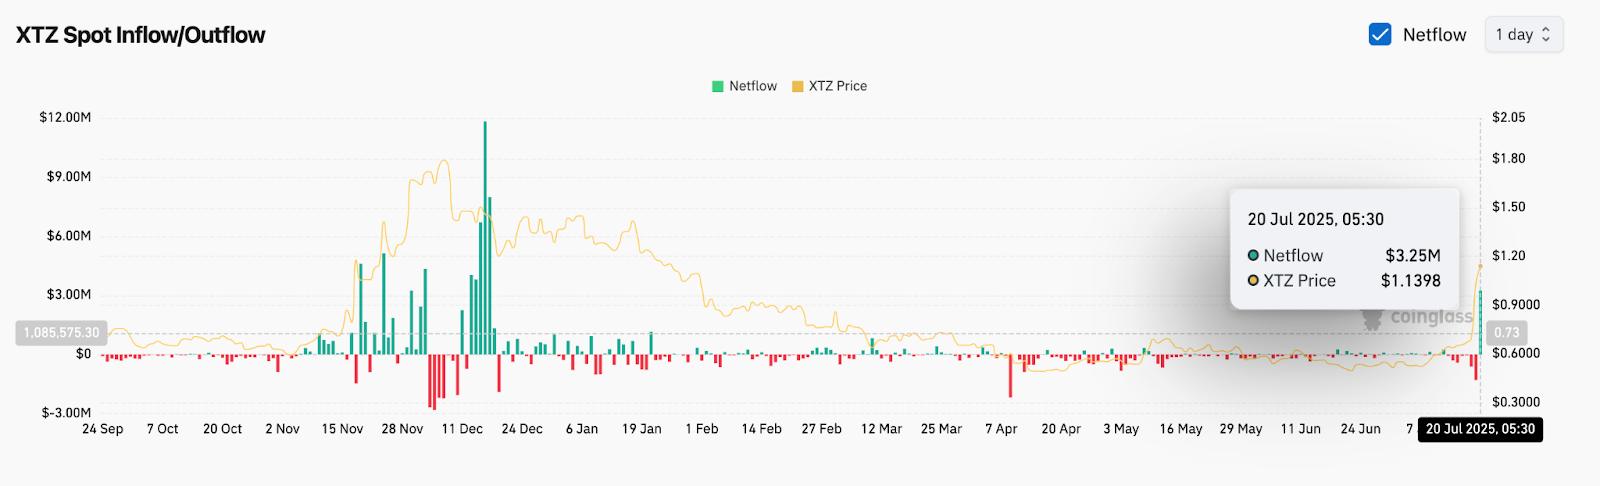
The question of why Tezos price going up today finds its answer in both momentum and capital inflow dynamics. According to Coinglass data, $XTZ spot netflow turned decisively positive, with over $3.25 million in net inflows on July 20, the highest single-day inflow in months. This confirms real capital entering the market, not just speculative pumps.
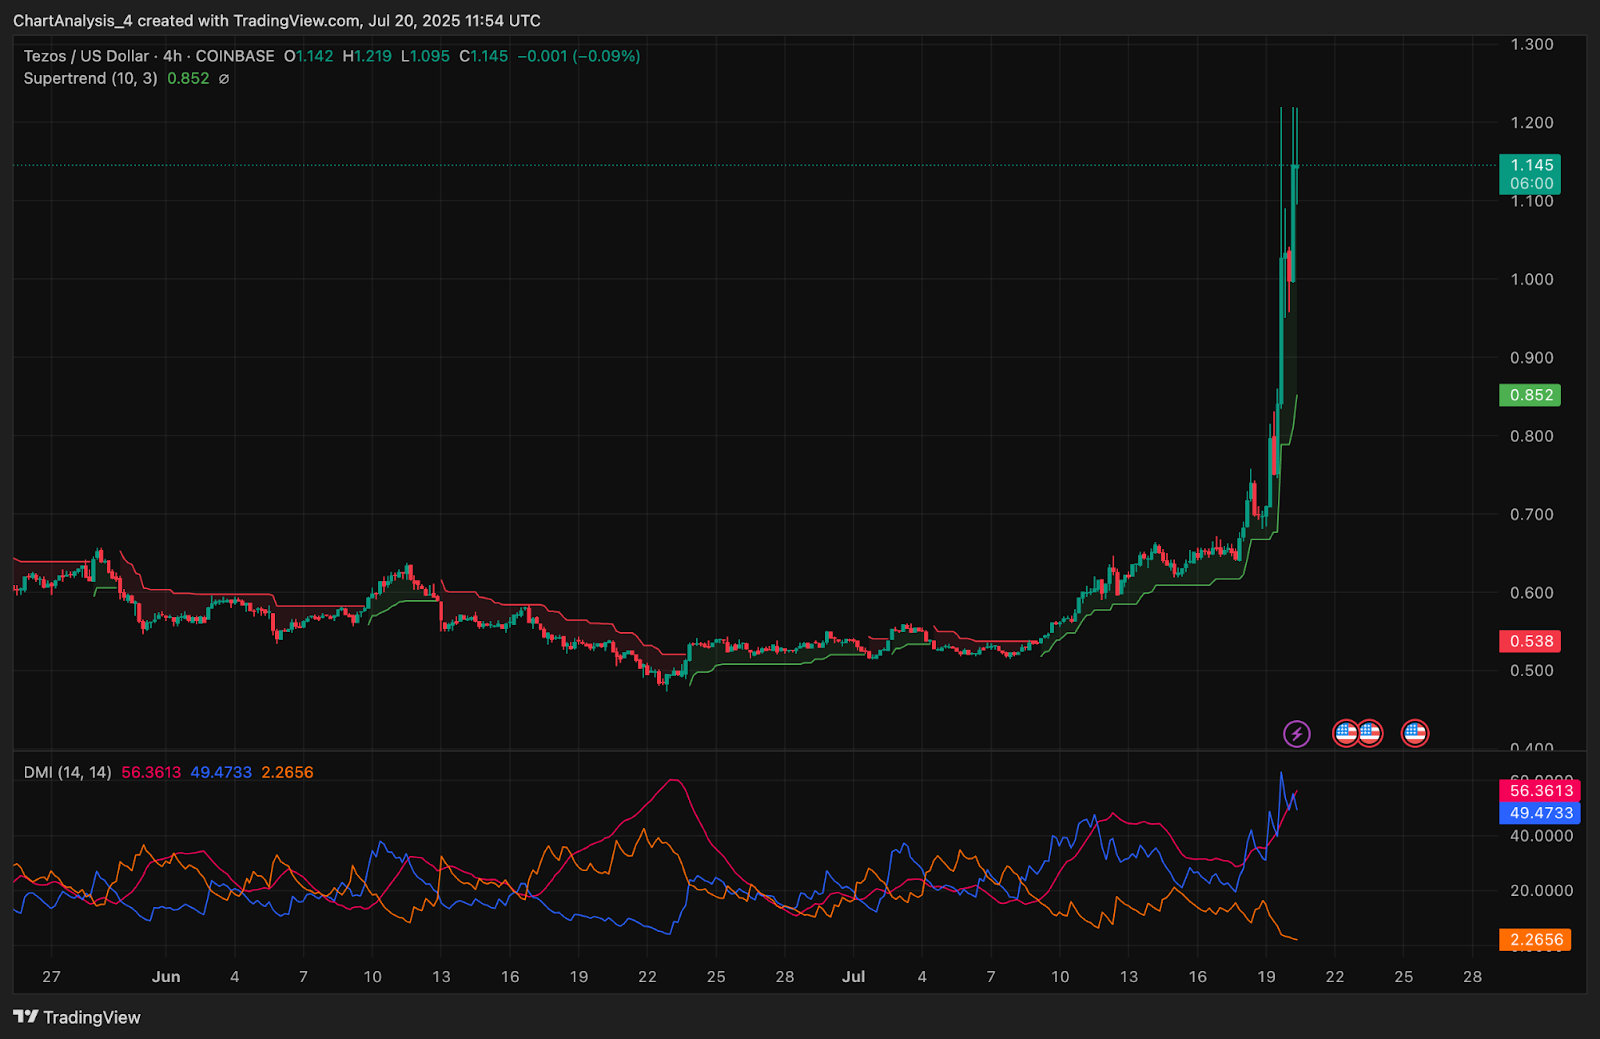
On the 4-hour chart, the Supertrend indicator has flipped bullish at $0.85 and remains firmly green. The Directional Movement Index also supports the strength, with +DI at 56.3 leading sharply above -DI at 2.2, while ADX at 49.4 reflects a strong trend in motion.
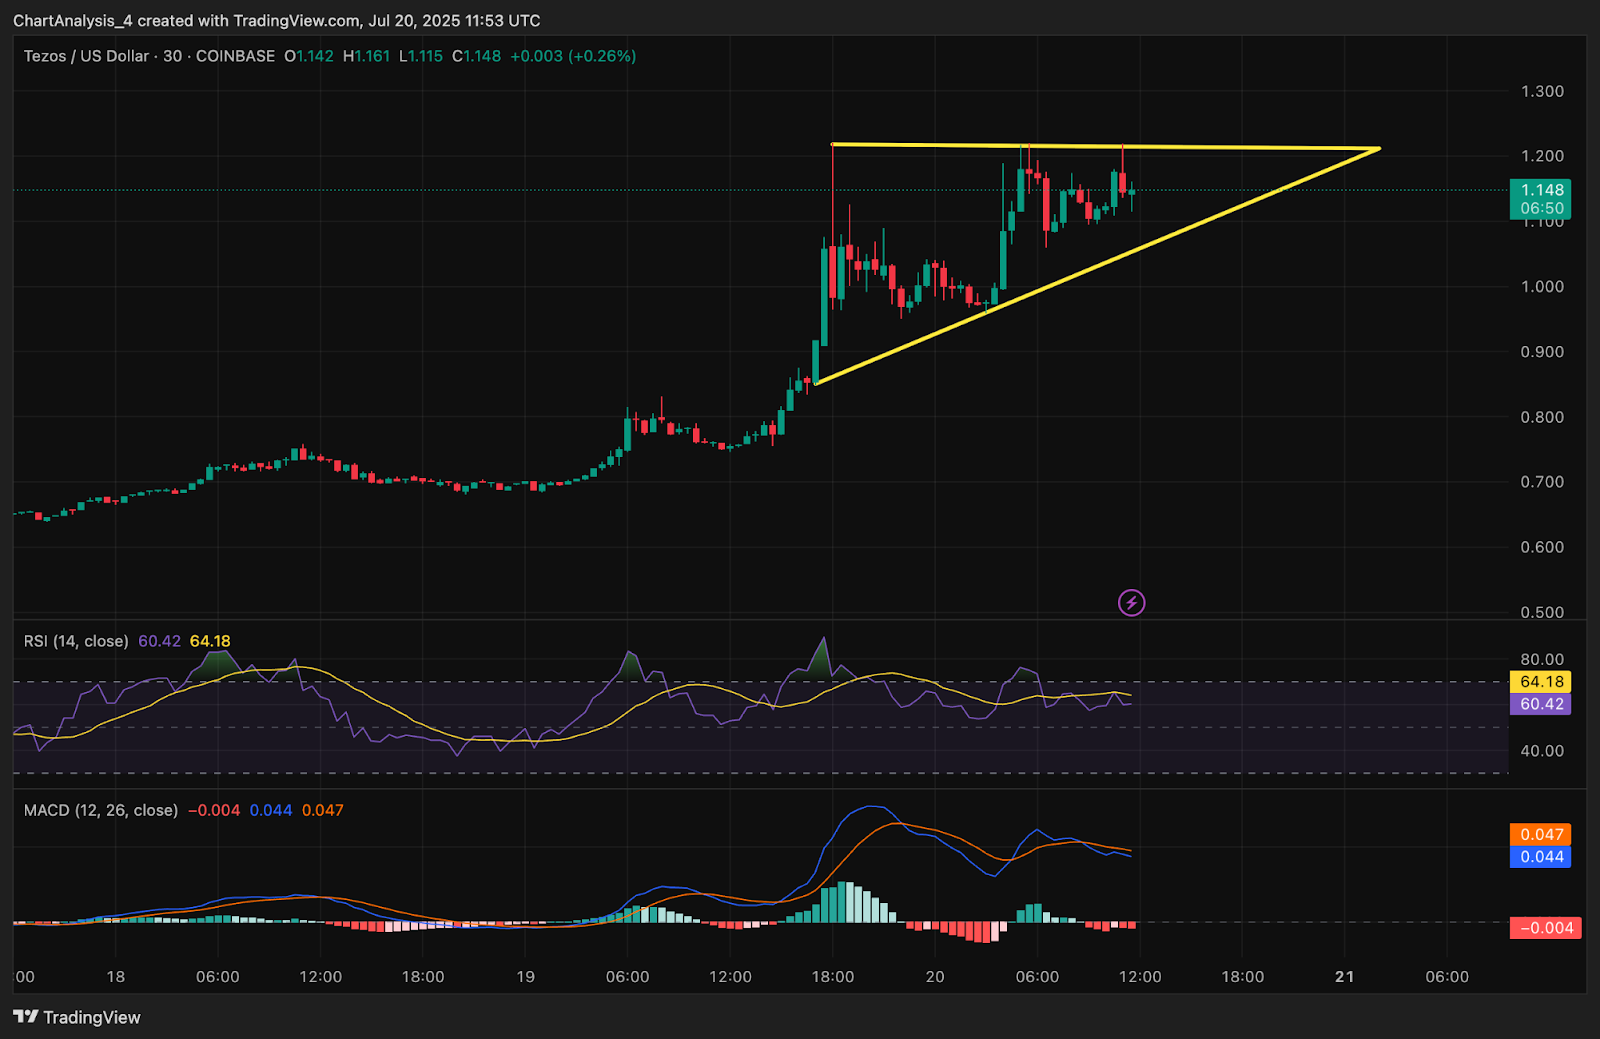
Short-term charts further reinforce this outlook. On the 30-minute timeframe, $XTZ price action is consolidating within a bullish ascending triangle. RSI sits around 64.1, indicating healthy strength but not yet overheated. MACD remains in positive territory, though the histogram shows early signs of consolidation.
Bullish Continuation or Exhaustion? Indicators Suggest Next Move
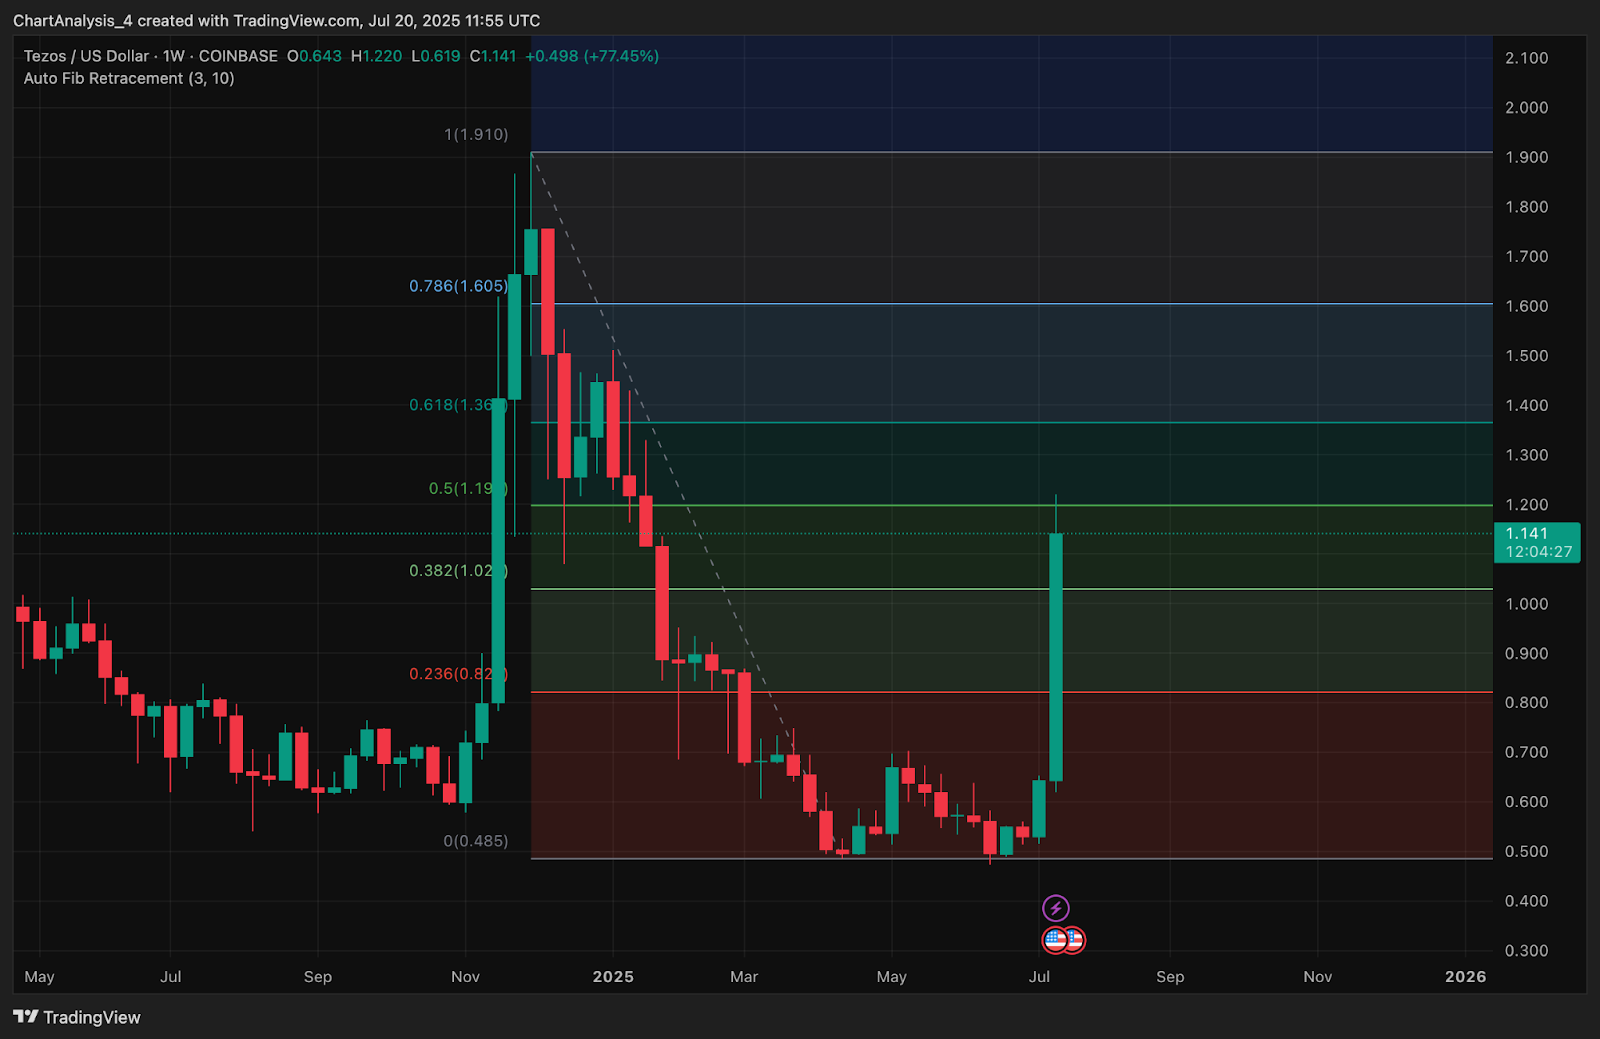
The weekly Fibonacci retracement places the current price just above the 0.5 level ($1.19). If $XTZ price today clears this barrier with volume, the next Fibonacci target is $1.36 (0.618 level), followed by $1.60.
That said, traders should be mindful of short-term overheating. The MFI near 99 signals overbought conditions, and the daily structure is pressing into multi-month resistance around $1.22–$1.25. If bulls fail to break above this band, a brief pullback to the $1.02–$1.04 area (38.2% Fib and Bollinger midline) is possible before continuation.
EMA alignment remains bullish across timeframes, with all dynamic levels now flipped below price. The 200 EMA on the daily sits near $0.70, reinforcing that the broader trend has reversed.
$XTZ Price Prediction: Short-Term Outlook (24H)
If bulls manage a confirmed breakout above $1.20–$1.22, Tezos price could extend toward $1.36 and even $1.60. A bullish continuation from the triangle structure on the 30-minute chart supports this possibility.
However, if price is rejected again at the $1.22 descending trendline, expect a minor retracement toward $1.04. This level coincides with Fibonacci and Bollinger support and may act as a launchpad for another leg up.
With strong net inflows, bullish Supertrend confirmation, and robust EMA alignment, Tezos holds a bullish short-term bias — but traders should watch the $1.20–$1.22 zone closely.
Tezos Price Forecast Table: July 21, 2025
| Indicator/Zone | Level / Signal |
| Tezos price today | $1.15 |
| Resistance 1 | $1.22 (descending trendline) |
| Resistance 2 | $1.36 (Fib 0.618) |
| Support 1 | $1.04 (Fib 0.382 / BB midline) |
| Support 2 | $0.85 (Supertrend base) |
| RSI (30-min) | 64.1 (Moderately Bullish) |
| MACD (30-min) | Positive, momentum cooling |
| MFI (1D) | 99.1 (Overbought) |
| DMI (4H) | +DI 56.3 / ADX 49.4 (Strong Trend) |
| Netflow (July 20) | +$3.25M (bullish capital inflow) |
| Supertrend (4H) | Bullish above $0.85 |
| Bollinger Bands (1D) | Expanded, breakout confirmation |
Disclaimer: The information presented in this article is for informational and educational purposes only. The article does not constitute financial advice or advice of any kind. Coin Edition is not responsible for any losses incurred as a result of the utilization of content, products, or services mentioned. Readers are advised to exercise caution before taking any action related to the company.
