


 22
22
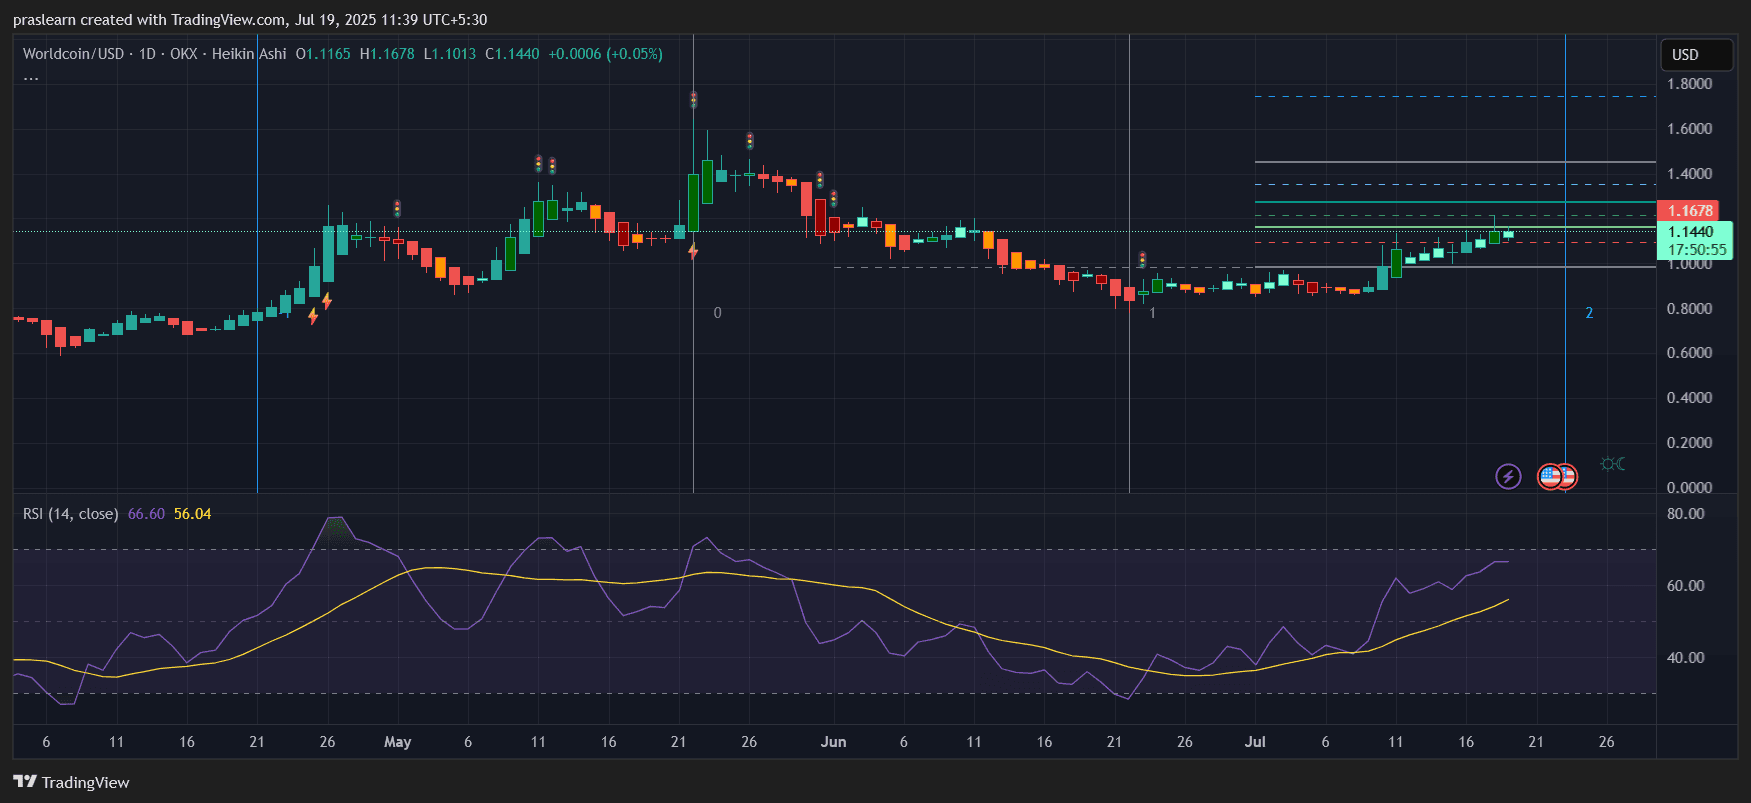
Worldcoin ($WLD) price is showing signs of a strong technical recovery after weeks of bearish pressure. With the daily chart flashing a bullish setup and RSI momentum building steadily, traders are now eyeing higher resistance zones — particularly the $1.50 mark. But can $WLD price break past the current resistance and rally in the short term? Let’s dive into the data and see what the chart says.
$WLD Price Prediction: Is Worldcoin Building Up for a Bigger Breakout?
 $WLD Price Prediction">
$WLD price is currently trading at $1.1440, with a recent intraday high of $1.1678. The chart shows a series of strong Heikin Ashi green candles with almost no lower wicks — a classic sign of trend strength and bullish momentum. This uptrend began in early July, bouncing from around $0.90, creating a swing gain of nearly 27.11% in just two weeks.
Calculation:
Percentage Gain=(1.144−0.90/0.90)×100≈27.11%
This momentum aligns with a rising RSI value of 66.60, approaching the overbought zone (above 70), but not quite there yet — indicating there's still room for upward movement.
Key Resistance Levels to Watch
The chart has Fibonacci retracement-style resistance levels drawn, suggesting targets at:
- $1.20 (minor psychological barrier)
- $1.33 – $1.38 (prior resistance cluster)
- $1.50 – $1.60 (major fib confluence and previous swing high)
The current bullish structure suggests that if Worldcoin price closes above $1.17 decisively with volume confirmation, it could trigger a breakout rally toward $1.33 – $1.38. After that, $1.50 becomes a viable target.
Can RSI Push Higher or Signal Reversal?
RSI (Relative Strength Index) is currently 66.60, rising steadily alongside the price. This suggests momentum is supporting the uptrend, but traders should keep an eye on any RSI divergence or sudden reversals near 70–75 zones.
Importantly, the RSI broke above its dynamic resistance trendline (visible from early June), further validating the shift from bearish to bullish sentiment.
Volume and Trend Structure: Are Bulls in Control?
Volume is gradually rising (though not visible in this chart), and the structure of the candles reflects strong buying pressure. Notably, this rally differs from the April and May rallies where prices spiked and then dumped quickly — this current trend is more measured and consistent.
This indicates possible institutional accumulation or patient buying, especially as Worldcoin fundamentals (like expanding biometric identity integrations) continue to gain global attention.
$WLD Price Prediction: Will $1.50 Hold or Break?
If bullish momentum sustains and no major rejection happens at $1.20 or $1.33, then Worldcoin price could reach $1.50–$1.60 within the next 10–14 days.
Here’s a projection path based on Fibonacci extension and historical behavior:
- Short-term target (next 3–5 days): $1.20
- Mid-term target (next 7–10 days): $1.33 – $1.38
- Aggressive breakout target (next 2 weeks): $1.50 – $1.60
However, if bulls fail to maintain the daily close above $1.17, and RSI rolls over, then $WLD price may revisit support at $1.00 or even $0.95 before trying again.
Is It Time to Buy $WLD?
Worldcoin price is showing a technically clean bullish setup after weeks of consolidation and decline. The ongoing trend is backed by a rising RSI, Heikin Ashi strength, and breakout structure. While risk still exists near key resistance zones, the upside potential toward $1.50 looks strong if momentum sustains.
Traders may consider entries on pullbacks to $1.10 – $1.12 with stop-loss below $1.00 and targets around $1.33 – $1.50. This rally could be Worldcoin price comeback moment — if it clears $1.33, we could be staring at a whole new phase of upside.
